

Which one do you need?
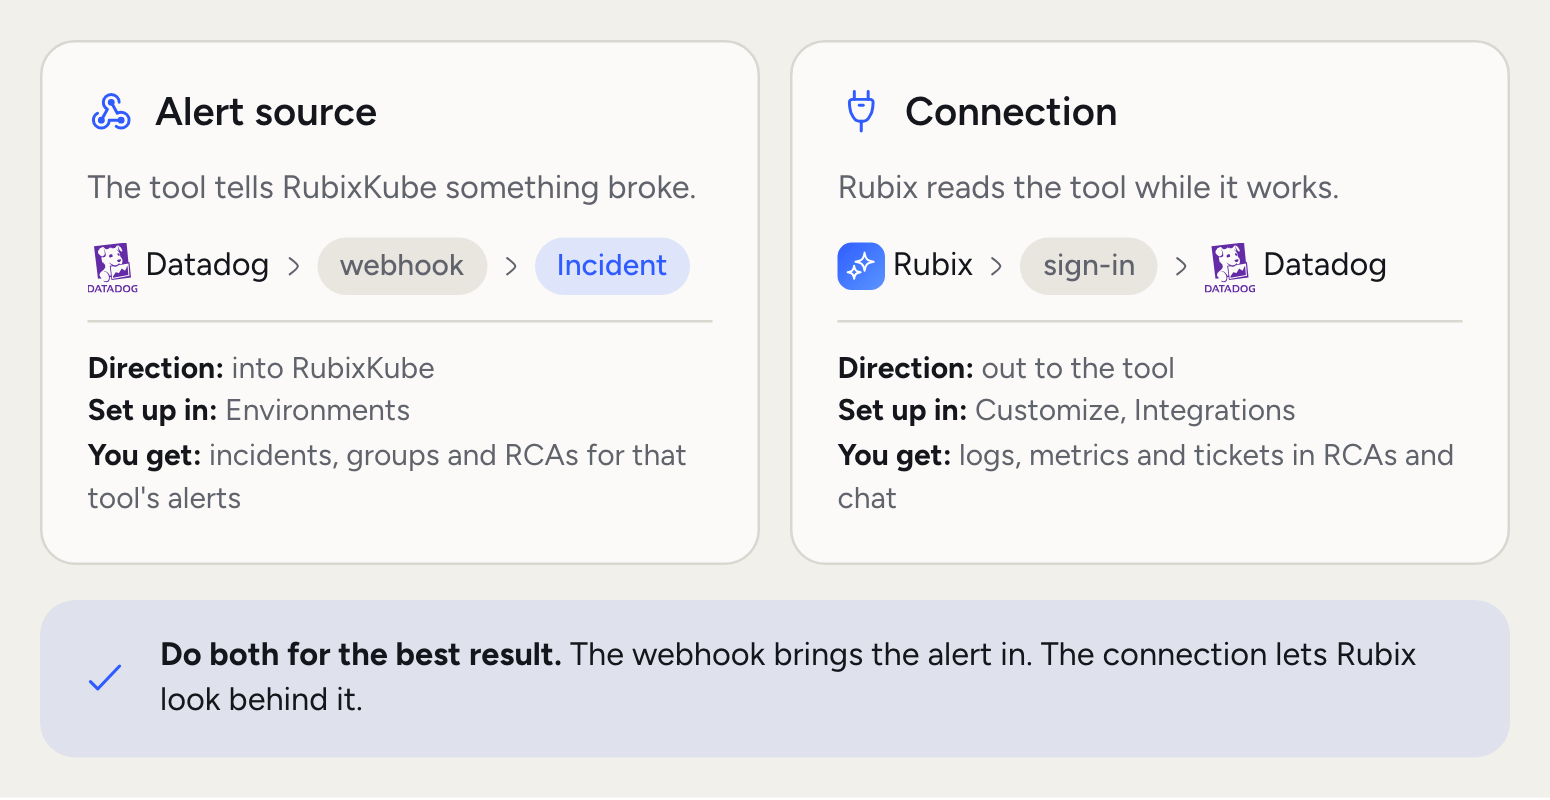
- You want Datadog alerts to become incidents. Set up an alert source.
- You want Rubix to read Datadog logs in an RCA. Add a connection.
- You want both. An RCA is only as good as what Rubix can read, so a webhook alone gives it less to work with.
- You want Rubix to read your code or docs. GitHub, GitLab and Notion are connections.
- Your tool isn’t listed, or it’s your own system. Use your own webhook to send alerts, or a custom integration so Rubix can read it.
Alert sources
An alert source is a tool that tells RubixKube when something breaks. It connects like any other source, under Environments > Connect. You pick the tool and RubixKube makes it a webhook of its own. You paste that URL into the tool. The source registers itself and shows up on Environments, and a built-in automation turns its events into incidents. Each tool’s page lists exactly which events open an incident and which resolve it.Connections
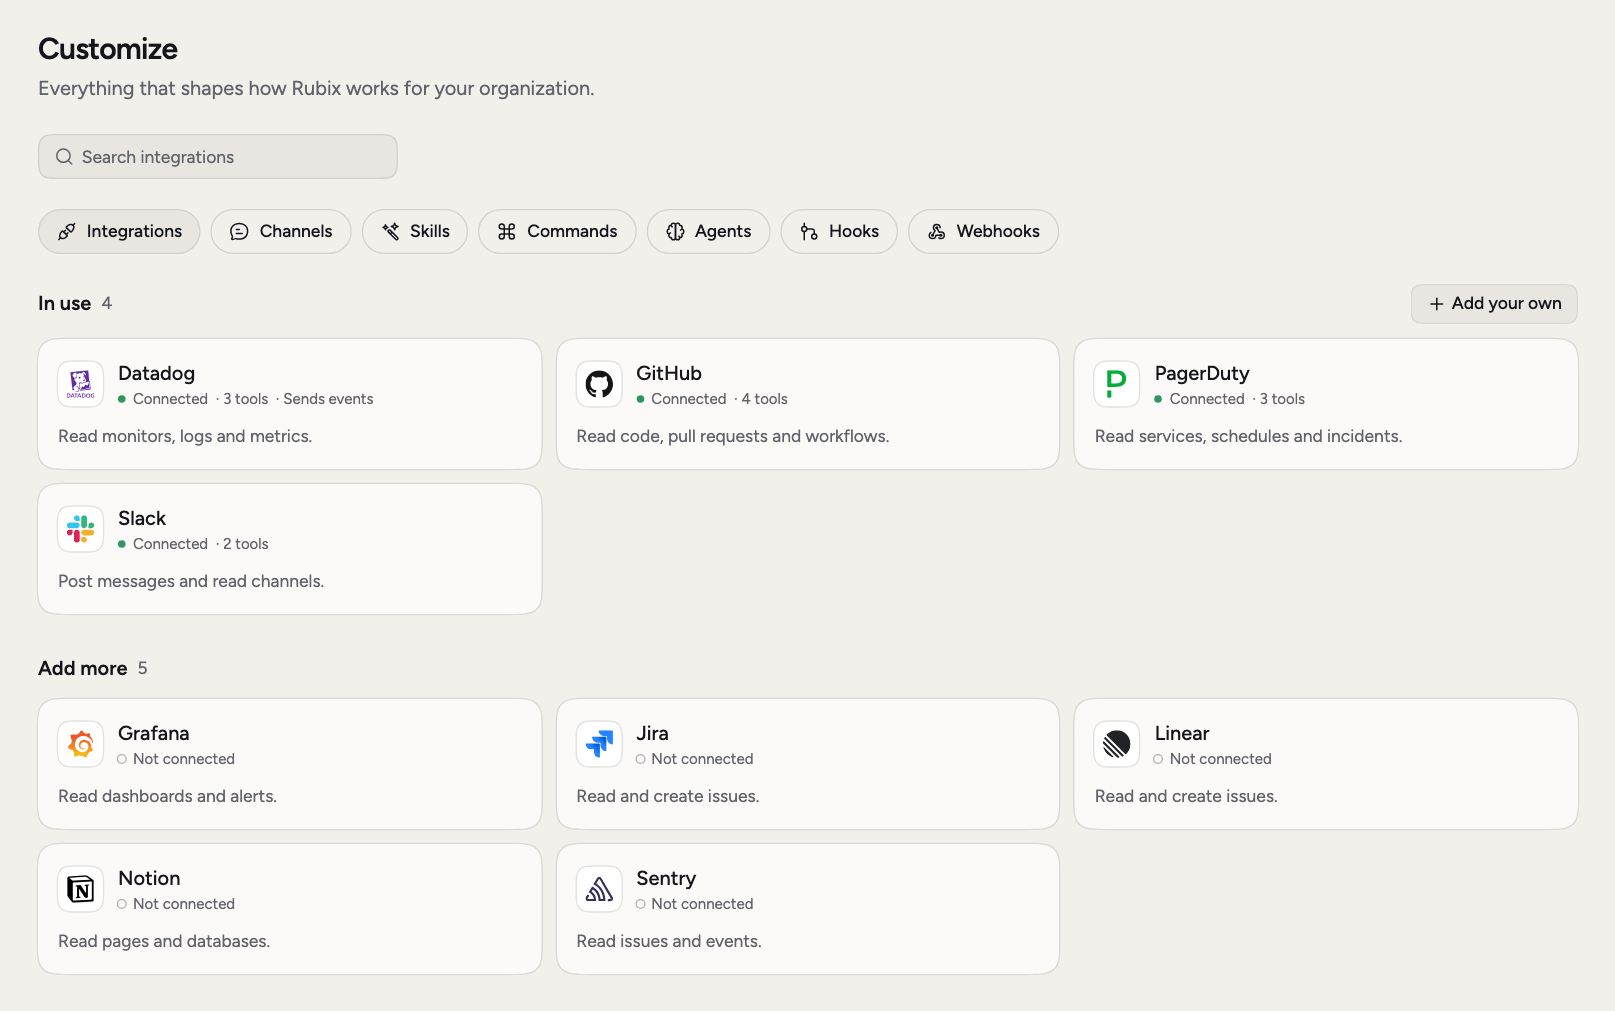
A connection lets Rubix read a tool. It adds evidence to an RCA and answers to your questions in chat. For example, Rubix can look through Datadog logs forpayments-api while it works out why the service is crash-looping.
What’s available in each
The catalog has the full list.
See what a connection can read
A connection that signs in doesn’t always reach anything useful. A token can have the wrong scope, or the logs can live somewhere else. So RubixKube checks. After you connect, sign in or press Test, RubixKube makes real reads against the tool over the last hour. The tool’s Reads section shows one row for each kind of evidence, such as Logs, Metrics, Alerts or Tickets, and each row says what happened.
The same rows appear on an alert source’s page under Environments. Datadog, PagerDuty, Observe and Atlassian Rovo get a read for each kind of evidence. Other tools get one read that shows the connection answers.
Your own tools
To connect something that isn’t in the catalog, choose Add your own under Customize > Integrations. You can add an MCP server or a REST API. Custom integrations are Business and Enterprise.Related pages
Catalog
Everything you can connect.
Your own webhook
Send incidents from anything that can post JSON.
Slack
Talk to Rubix and follow incidents in Slack.
Rubix MCP
Use RubixKube from your AI tools.