1
Create your account
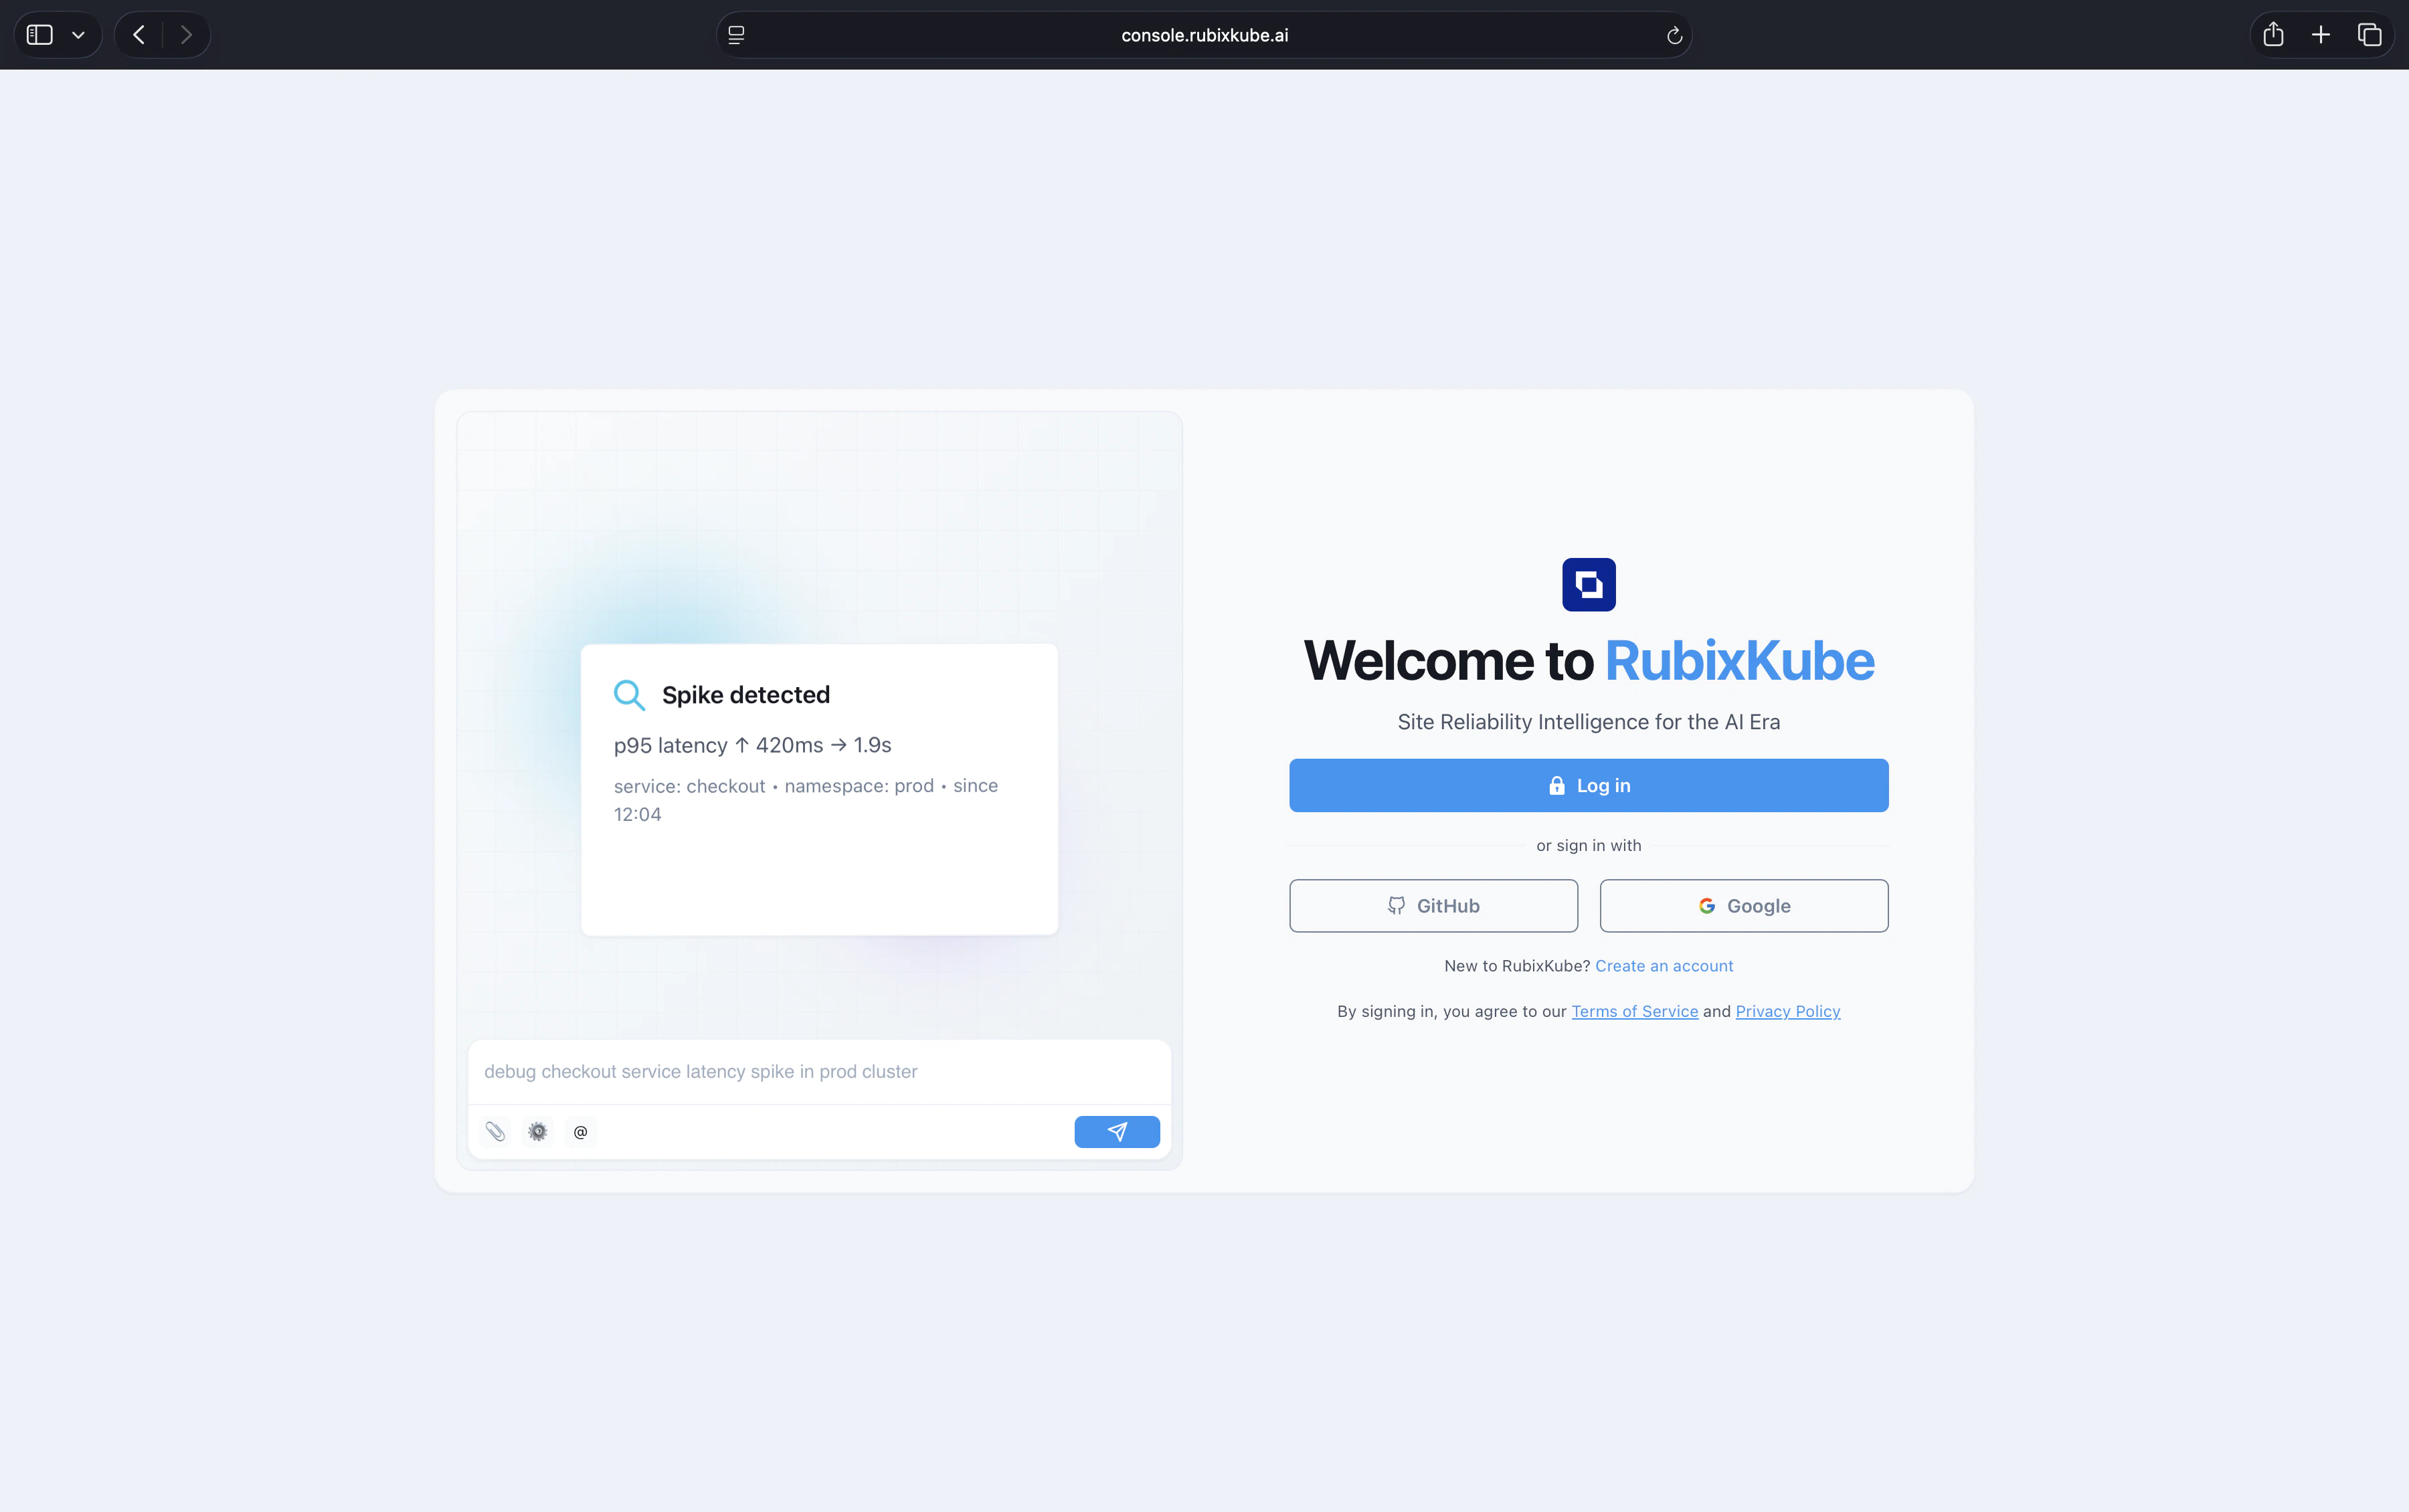
Sign up at console.rubixkube.ai using email, GitHub, or Google. Already have an account? Just log in.The free tier covers one environment, up to five monitored apps, and ten investigations per month. See Pricing for higher tiers.
2
Connect an environment
RubixKube needs something to observe. Pick the environment you want to start with and run the install.
Connect your environment
Full install flow for Kubernetes, AWS, GCP, and Linux VMs. Five to ten minutes.
3
Ask your first question
Once the environment card shows Healthy, open Chat in the console and try:Answers come with cited evidence. Investigations worth escalating surface in Insights as RCA reports.
Where to go next
Monitor infrastructure health
Set up the dashboard, insights, and notifications for your team.
Understand the concepts
Site Reliability Intelligence, the Agent Mesh, and the OPEL loop.
Invite your team
Roles, workspaces, and collaboration.
Need help?
Email connect@rubixkube.ai with your tenant ID. A human engineer will respond.