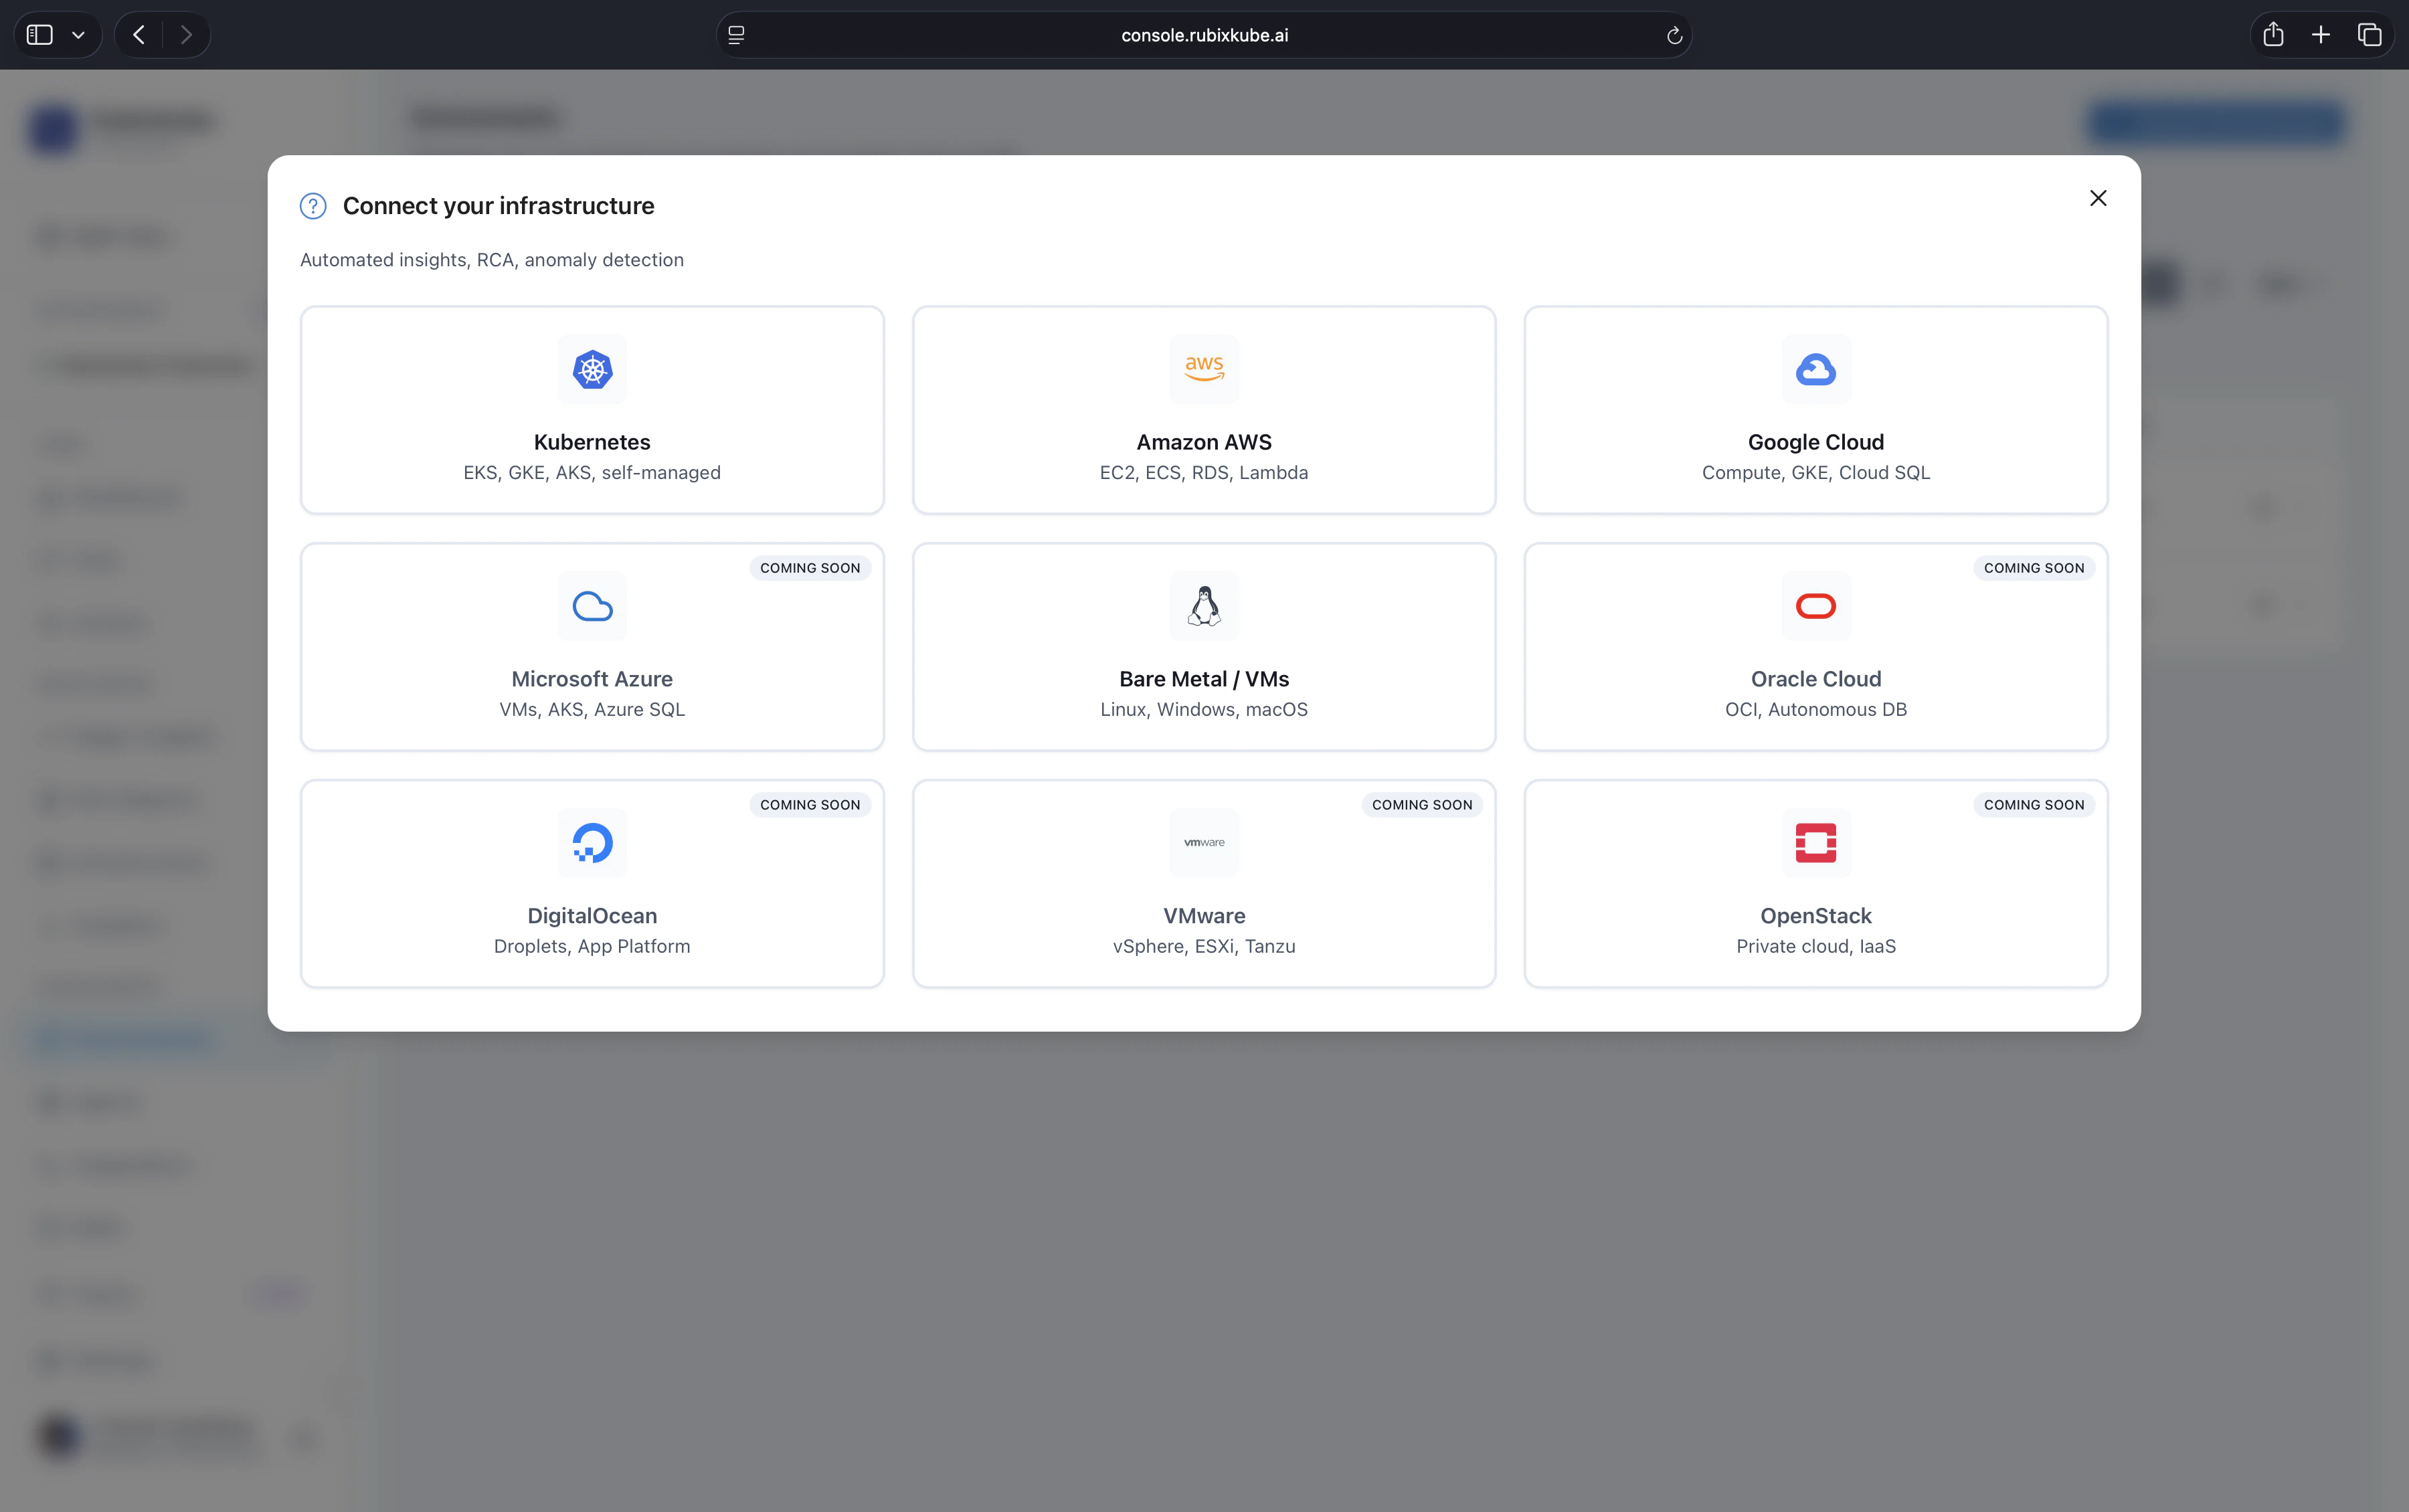
Pick your path
Kubernetes
EKS, GKE, AKS, KIND, or any conformant cluster on v1.24 or later. Install via
kubectl apply.AWS
Account-level observation across EC2, RDS, Lambda, S3, ELB, CloudTrail, and CloudWatch.
GCP
Project-level observation across GCE, GKE, Cloud SQL, Cloud Run, Cloud Storage, and Cloud Functions.
Linux VMs
Any modern Linux host. CPU, memory, disk, network, and per-process signals.
Running on Azure? AKS clusters are supported today via the Kubernetes path. Subscription-level Azure observation (App Service, Azure VMs, managed data) is on the roadmap. Email us to join the early-access list.
The install, in three moves
Every environment follows the same shape. The per-environment pages above cover the specifics.1
Copy the personal command from the console
Open Environments in console.rubixkube.ai, create a new environment, and copy the install command. Your API key (starting with
rk_) is already embedded, so you can paste and run.The shape looks like this:2
Run it against the target environment
The Kubernetes manifest applies in one shot. The shell installer is interactive and asks where to deploy:Pick option 1 to install on the current host, option 2 to spin up a fresh EC2 instance, or option 3 for a fresh GCE instance. Follow the region and project prompts from there.
3
Verify it is running
- Kubernetes
- AWS (new EC2)
- GCP (new GCE)
- VM or existing host
Running.In the console, the environment card switches from Connecting to Healthy within a minute or two and the Infrastructure view populates with a live topology.
What the Observer does
The Observer is deliberately light: it collects signals, maintains a local cache, and streams to RubixKube Cloud. It never sends raw payloads outside of what you configure.- Discover. Walks your environment through read-only APIs and builds a live topology.
- Stream. Sends structured events, metrics, and state snapshots to RubixKube Cloud over HTTPS and NATS.
- Stay out of the way. Read-only by default. No mutations without explicit approval, enforced by the Guardian agent.
Requirements at a glance
After you connect
Monitor infrastructure health
Set up the dashboard, insights, and notifications for your team.
Understand Environments
Manage multiple environments, review health, and reorganise workspaces.
Set up integrations
Connect Slack, Linear, PagerDuty, and more.
Safety and Guardrails
Understand what RubixKube will and will not do on its own.
Common questions
Can I connect multiple environments at once?
Can I connect multiple environments at once?
Yes. Each connection is independent, so you can run them in parallel. Free tier allows one environment, Business allows up to three, Enterprise is unlimited.
What permissions does the Observer need?
What permissions does the Observer need?
Read-only by default, scoped to the platform you are monitoring. Anything that could change state needs explicit approval and is bounded by Guardian policies. See Safety and Guardrails.
Does my data leave my environment?
Does my data leave my environment?
Structured events, metrics, and state snapshots stream to RubixKube Cloud for correlation. Raw payloads stay in your environment unless you explicitly enable them.
What if my cluster is air-gapped or behind strict egress?
What if my cluster is air-gapped or behind strict egress?
The Observer only needs outbound HTTPS to
api.rubixkube.ai:443 and nats.rubixkube.ai:443. If that is not possible, reach out and we can talk through a deployment mode that fits your controls.How do I remove an environment?
How do I remove an environment?
Delete it from Environments in the console, then run the appropriate uninstall. For Kubernetes:
kubectl delete -f "https://api.rubixkube.ai/install/observer.yaml?apiKey=rk_YOUR_API_KEY". For shell installs: rerun the installer and pick Uninstall Observer.