

What makes an incident
- Where it came from. An observer, a connected tool, a person or an agent. The incident says which.
- Severity. Low, Medium, High or Critical.
- Evidence. What the observer or tool sent: the event, logs and recent changes it saw.
- Scope. An incident names the affected resource and the source it lives on.
- A short code. INC-12, unique in your organization. Use it in chat, or with any tool that takes an incident.
How incidents differ from alerts
The incident lifecycle
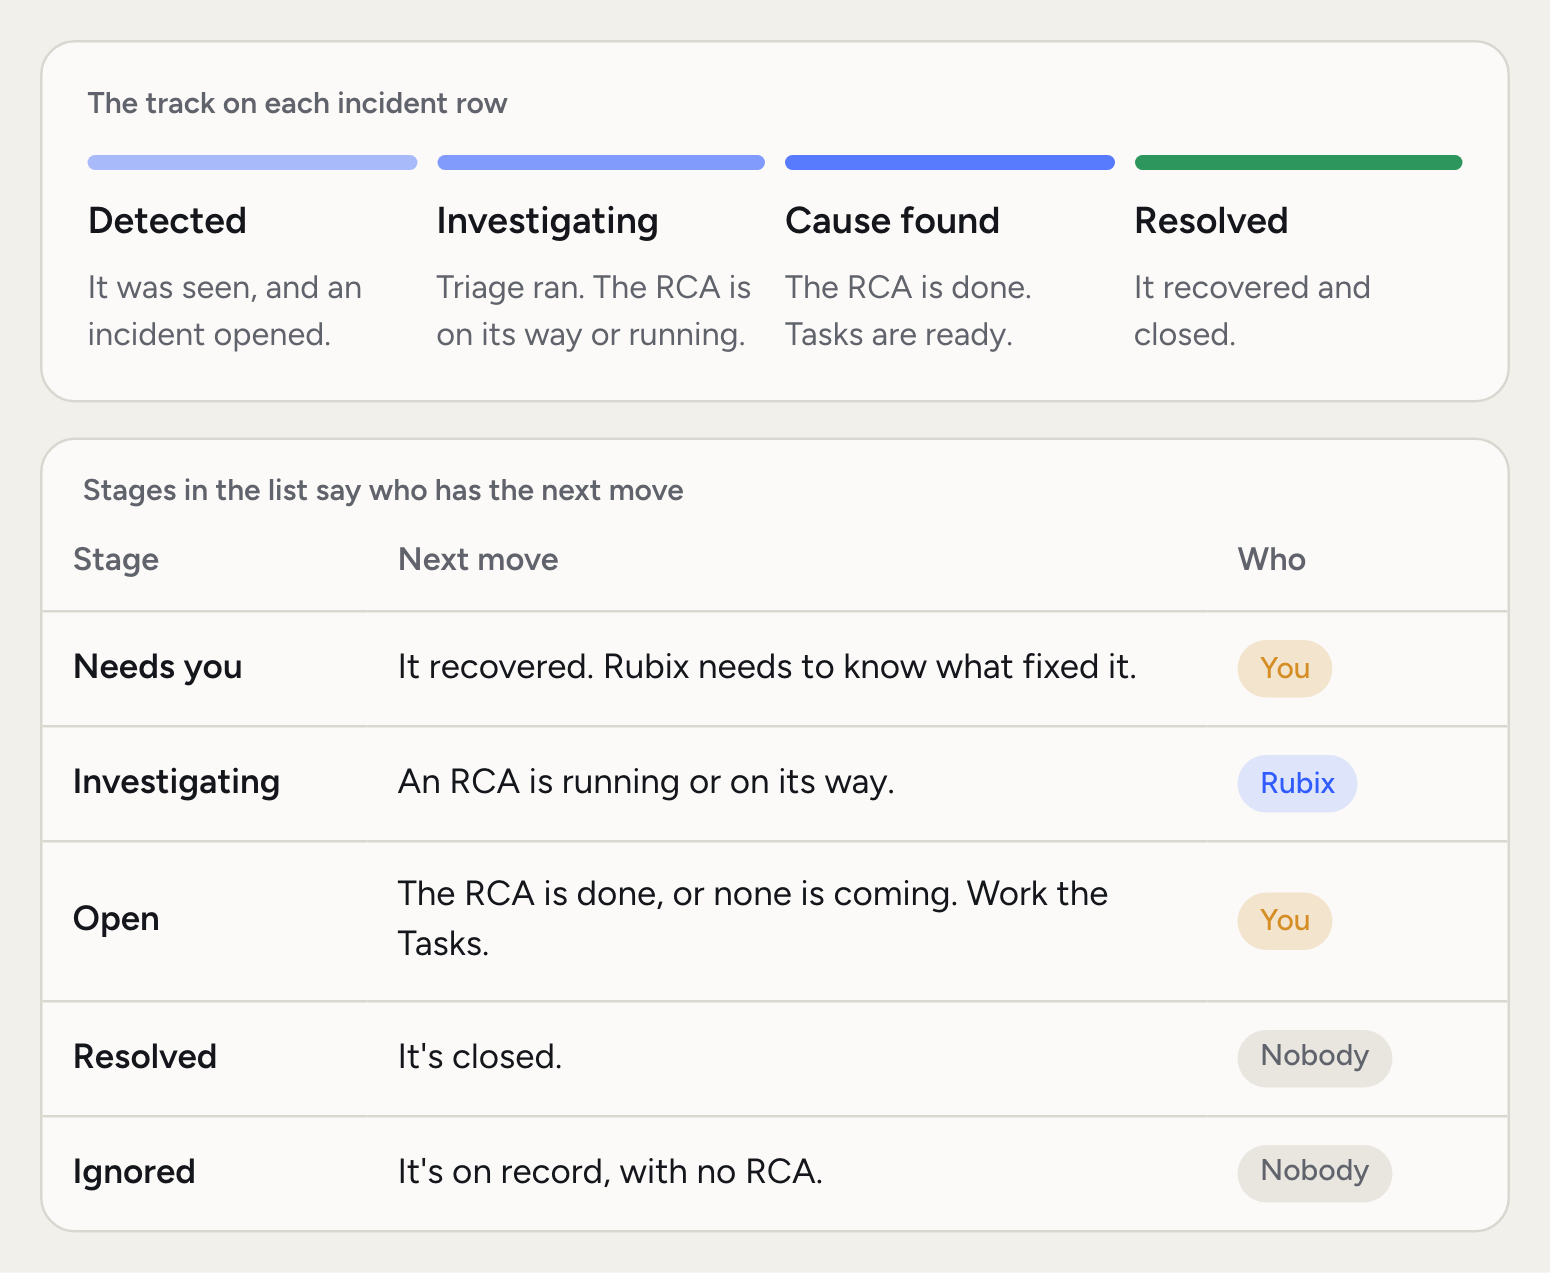
Detected
A rule fires or an alert arrives. The incident opens and subscribers get notified on the channels you set in Notifications.
Triaged and grouped
Triage can change the severity and impact, hold the RCA, or mark the alert as known. Related incidents join a group.
Investigated
After a short wait by severity, Rubix writes an RCA. The incident page shows when it will start and how far along it is.
Worked
The RCA suggests Tasks. Your team picks them up, or asks Rubix for help in chat.
Groups
When one cause breaks several things, you don’t want several investigations. Incidents join a group when they’re on the same resource, or share a cause, within 30 minutes on one source. The list shows it as one row marked Group, with a stack icon.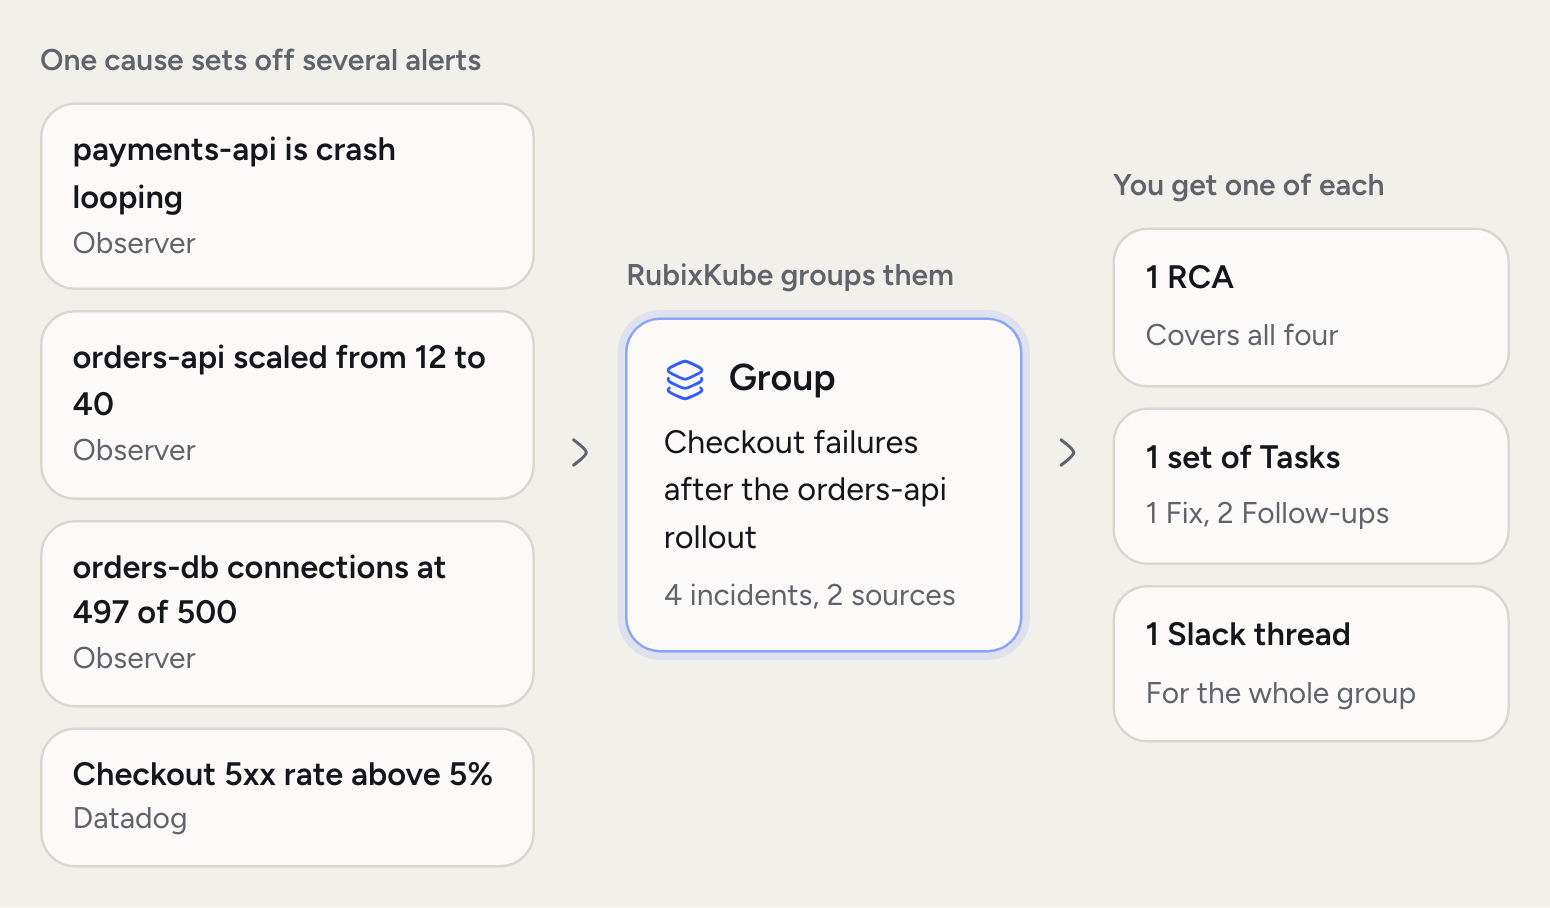
payments-api crash-looping and a Datadog alert on orders-db end up together, if the Datadog source and the cluster are linked.
The Classify incidents automation handles bursts. When many incidents arrive at once from one source, it folds them into one group. If a member breaks again after its group’s Fix, it leaves the group and gets looked at on its own.
Recovery
Observers keep checking every open incident. Connected tools send their own recovery messages, and those resolve the incident.The observer sees it healthy
It checks every minute. A first healthy reading shows the incident as Verifying, and any RCA that hasn’t started waits to see if the recovery holds.
It stays healthy
After 10 minutes healthy, the observer reports the recovery and the changes it saw. RubixKube records why: fixed by a change, recovered on its own, or the resource was removed.
Someone confirms, if needed
When the reason isn’t clear, the incident moves to Needs you and asks What fixed it?. Your answer is kept for next time.
Severity, and how it is set
Severity starts with whoever reported the problem, and triage can change it.The rule or the alert
The rule or the alert
An observer rule has its own severity. A connected tool’s handler maps the tool’s priority to ours. A Datadog Warn opens one severity lower than an Alert.
Triage
Triage
The Triage incident automation reads the incident and can raise or lower the severity and set the impact.
What severity changes
What severity changes
It decides how long the RCA waits. Critical starts right away, High waits 2 minutes, Medium 5, Low 10. You can change these waits in Settings > Incidents.
What to do with an incident
- Read. Open it. Skim the evidence, the affected resources and the RCA when it lands.
- Investigate. Click Ask Rubix to ask questions. The chat starts with the incident in view.
- Route. Assign a Task to a teammate, or leave a comment and mention them. Mention @Rubix in a comment to bring Rubix in.
- Close or ignore. Close it when it’s done. If it’s expected, Ignore keeps that exact problem on record without an RCA.
Common questions
Why did I not get an incident for this?
Why did I not get an incident for this?
Usually one of four reasons. No rule matched. The problem cleared during the observer’s hold. Its namespace or workload is on the source’s ignore list. Or it counted as another sighting of an open incident on the same resource.
Can I turn incidents off for a resource?
Can I turn incidents off for a resource?
Yes, on Kubernetes. Open the source, then Configuration > Ignore, and add namespaces or workloads. Problems there don’t raise incidents, and their pods stay in the topology.
How fast is detection?
How fast is detection?
An observer holds a new problem for at least 30 seconds, so things that fix themselves don’t flood the list. By default it reports after 3 checks or 5 minutes, and some rules wait longer, such as 2 minutes for a pending pod. You can change the timing in Configuration > Timing.
Does every incident get an RCA?
Does every incident get an RCA?
No. A group shares one RCA. An incident that recovers before its RCA starts doesn’t get one, and neither does one triage marks as known or one that’s Recurring. You can start one yourself with Run the RCA again. An RCA that can’t settle the cause is still published, and it says so.
Related concepts
Root cause analysis
How an incident becomes a report with cited evidence.
Incidents in the console
The page where you work with incidents.