Connect a GCP project and the Observer maps every major service in it: GCE, GKE, Cloud SQL, Cloud Run, Cloud Storage, and Cloud Functions. The installer provisions a service account and attaches the right viewer roles automatically. You can run the Observer on an existing Linux VM inside your project, or let the installer create a fresh GCE instance.
Connect Google Cloud dialog with a one-line installer command, the API key input, the list of what will be monitored (Compute Engine, GKE and Cloud Run, Cloud SQL, Cloud Monitoring), and a system requirements callout.

Prerequisites

gcloud authenticated

gcloud config get-value project returns the target project. You can switch projects mid-install.

IAM to create service accounts

The installer needs permission to create a service account and attach viewer roles. Project-level Owner or Editor works.

A Linux host

Either an existing GCE instance or any Linux VM with outbound HTTPS. The installer can also spin up a fresh GCE instance.

A RubixKube workspace

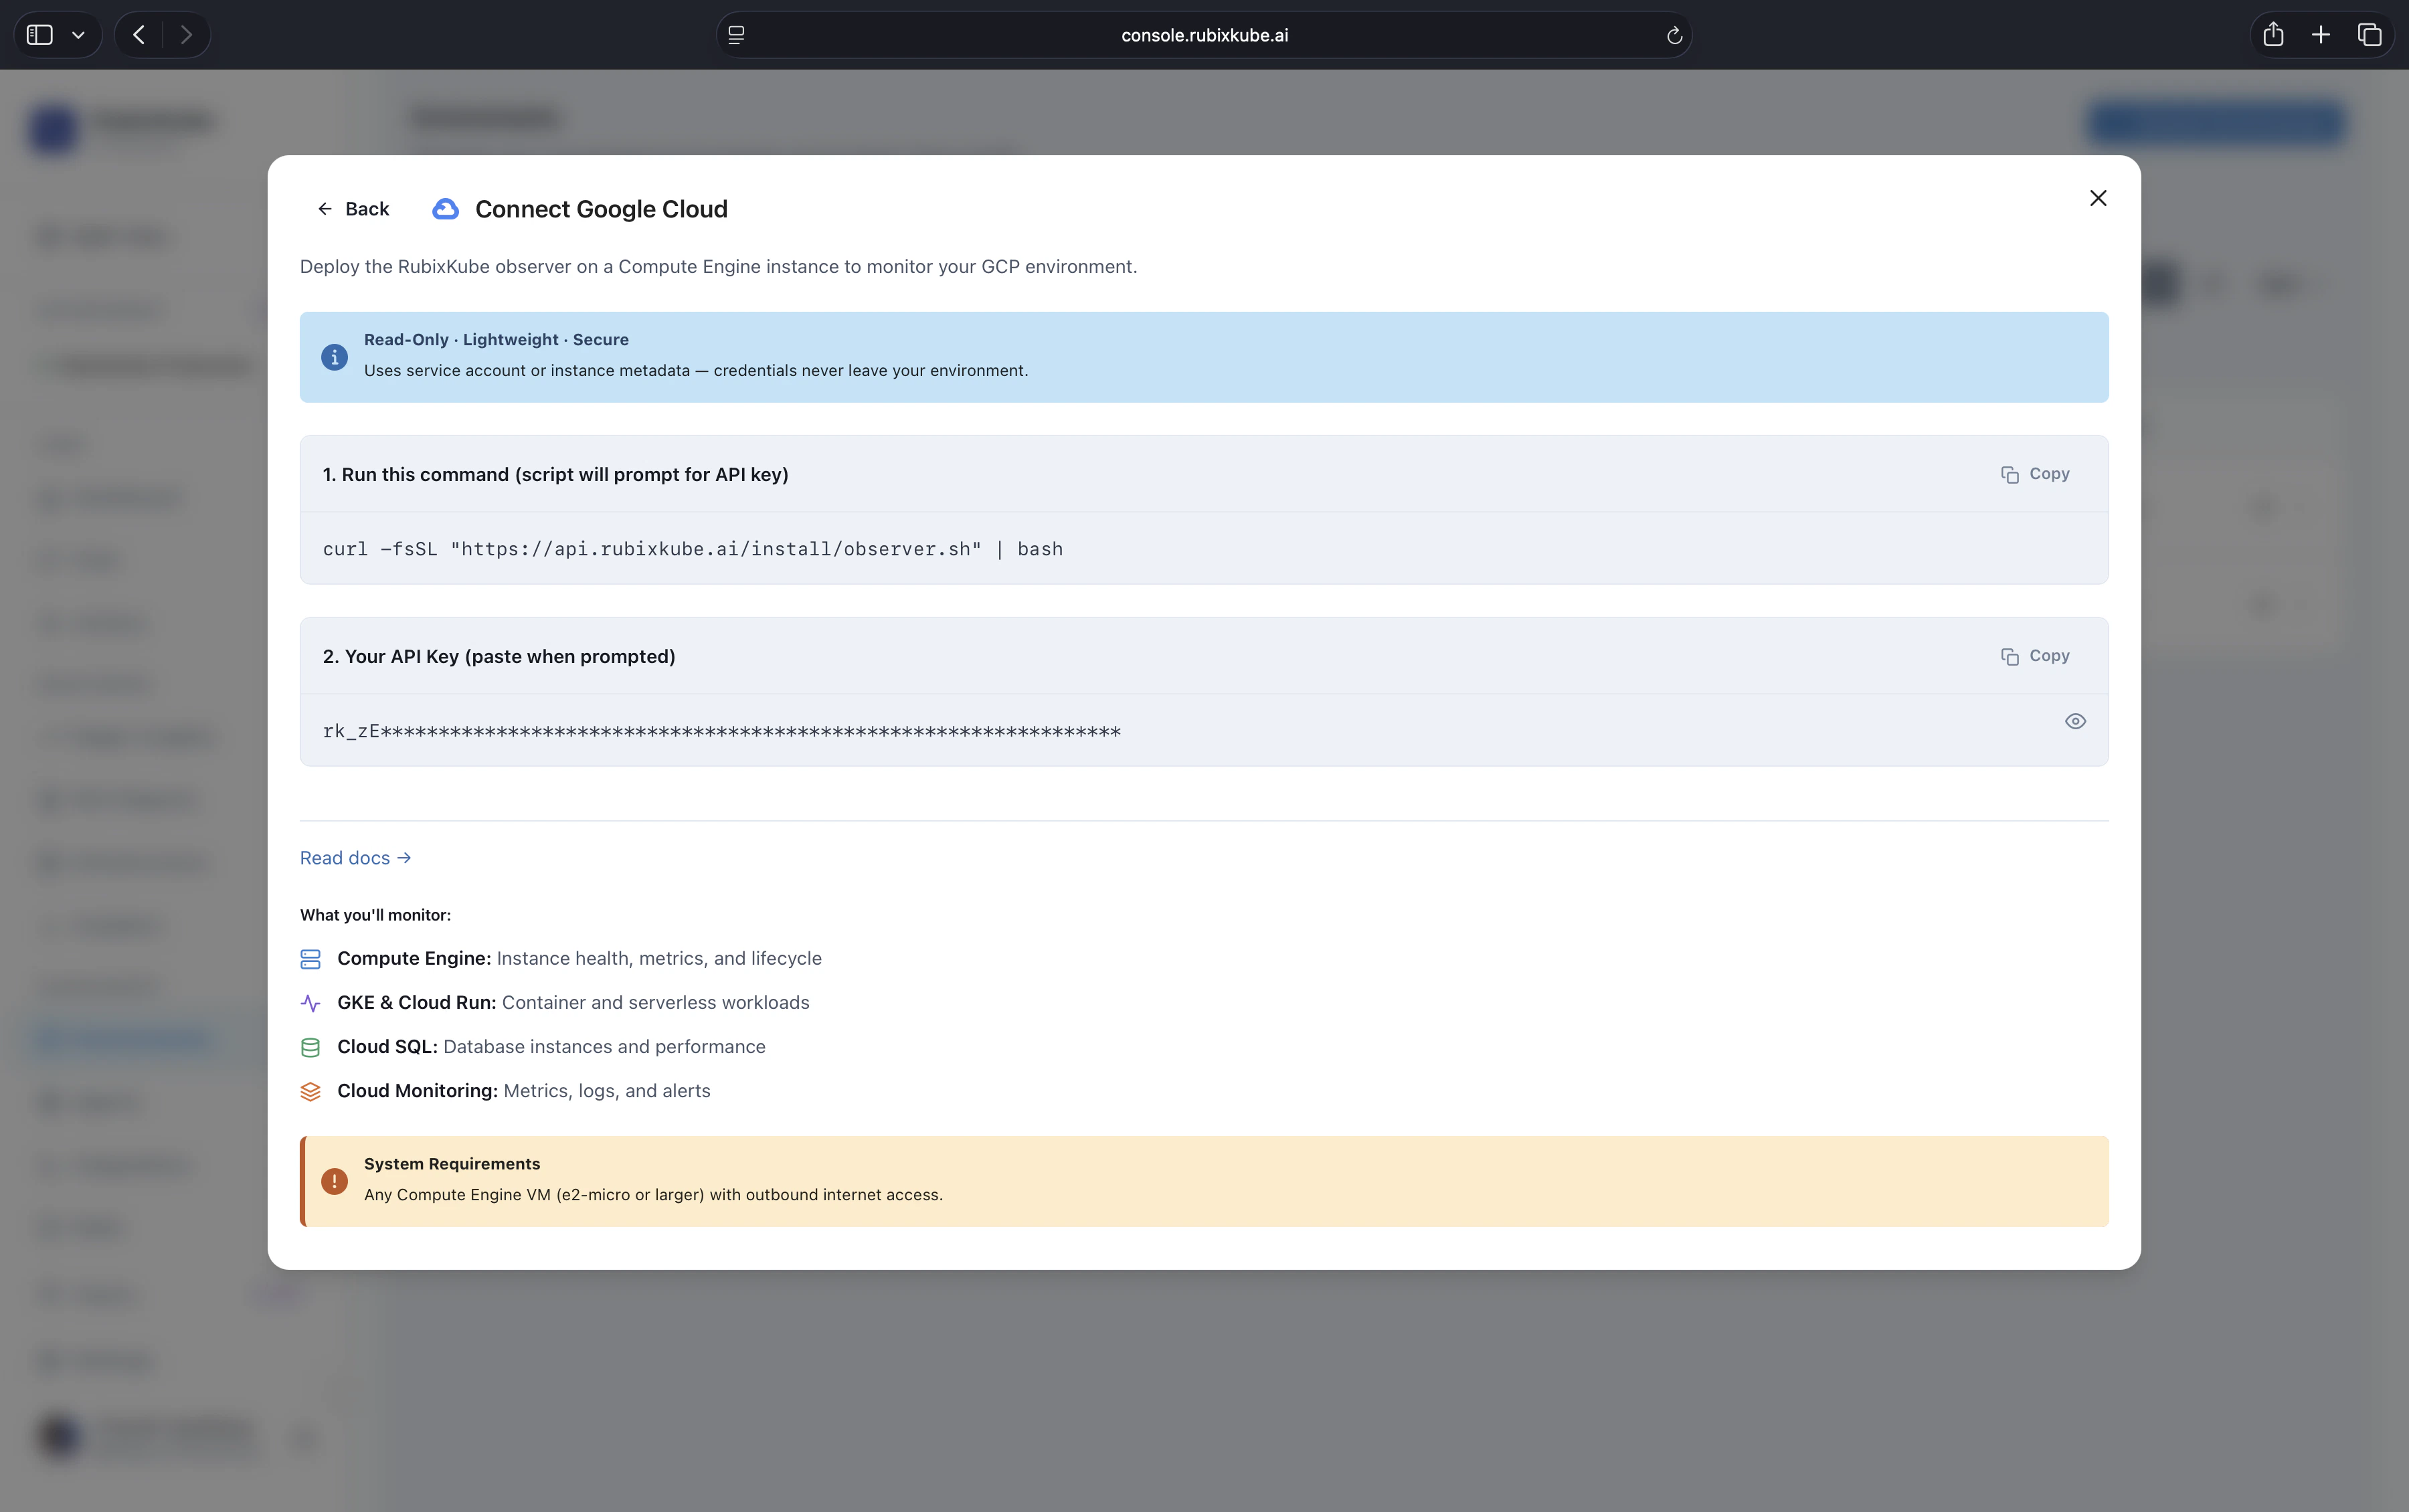
Create a new GCP environment in the console to get your personal install command.

Install

On the machine you want to run the Observer on:
curl -fsSL https://api.rubixkube.ai/install/observer.sh | bash -s -- --api-key=rk_YOUR_API_KEY
Always copy the command from the console. The embedded API key scopes the Observer to your workspace.

Interactive flow

For GCP:
What would you like to do?
  1) Install Observer
  2) Uninstall Observer
> 1

Where do you want to deploy the observer?
  1) On this machine
  2) Create a new AWS EC2 instance
  3) Create a new GCP Compute Engine instance
> 3   (or 1 to install on an existing VM)

Which platform are you monitoring?
  1) VM (generic Linux)
  2) AWS
  3) GCP
> 3

GCP Project ID [current-project]:
GCP Region [us-central1]:
The installer enables the required APIs (compute, monitoring, logging), creates a service account, attaches viewer roles, and starts the Observer as a systemd service on the host (or boots a fresh GCE instance labelled rubixkube=observer).

Verify

sudo systemctl status rubixkube-observer
Tail the logs:
sudo journalctl -u rubixkube-observer -f
Within a minute or two, the GCP environment card in the console switches from Connecting to Healthy and Infrastructure Topology populates with GCE instances, GKE clusters, and related resources.

What is being monitored

ServiceSignals
GCEInstance state, CPU, memory, disk, network, scaling events
GKECluster and node pool state (clusters can also be connected directly via the Kubernetes path for deeper visibility)
Cloud SQLInstance health, connections, storage, replication lag
Cloud RunService health, request rate, latency, cold starts
Cloud StorageBucket inventory, access patterns, size trends
Cloud FunctionsInvocations, duration, errors
Cloud MonitoringNative metrics for every service above, plus any custom metrics you publish
Cloud LoggingReliability-relevant audit logs, filtered and correlated

IAM scope

The installer attaches the following roles to the service account:
  • roles/compute.viewer
  • roles/container.viewer
  • roles/storage.viewer
  • roles/monitoring.viewer
  • roles/logging.viewer
  • roles/cloudsql.viewer
  • roles/run.viewer
No mutating roles. If you prefer to pre-create the service account with narrower scopes, reach out for a manual install path.

Multi-project setup

Connect each project as its own environment. All of them feed the same workspace. For organisations with many projects under a common folder or organisation node, Enterprise customers can bulk-enroll. Email us to set this up.

Troubleshooting

sudo journalctl -u rubixkube-observer -n 50
Most common causes: invalid API key, required APIs not enabled on the project, missing IAM permissions on the host’s service account, outbound HTTPS blocked.
Enable them manually if the installer was run without enable permissions:
gcloud services enable compute.googleapis.com container.googleapis.com \
  sqladmin.googleapis.com monitoring.googleapis.com logging.googleapis.com \
  run.googleapis.com cloudfunctions.googleapis.com
Verify the service account attached to the host:
gcloud compute instances describe INSTANCE_NAME --format='value(serviceAccounts[0].email)'
gcloud projects get-iam-policy PROJECT_ID --flatten='bindings[].members' --filter='bindings.members:SA_EMAIL'
Attach missing roles from the list above.
Either Cloud Monitoring does not have metrics for that service in the region yet, or the project does not have the service enabled. Enable the service and wait a few minutes for metrics to populate.

Uninstall

Rerun the installer and pick option 2. It stops the systemd service, removes the binary, and deletes the service account and role bindings (unless you ask it to keep them). If the Observer runs on an installer-created GCE instance, the uninstall also deletes the instance and any firewall rules it created.

Connect your environment

The full install flow covering every supported environment.

Kubernetes (for GKE)

For deeper pod-level visibility on GKE, install the Kubernetes Observer alongside the GCP project observer.

First tutorial

Monitor infrastructure health once the Observer is live.