Start Building
Quickstart
Connect your first environment and see your first investigation in under 10 minutes.
How it Works
Understand the OPEL loop, the Agent Mesh, and how the Memory Engine compounds over time.
Platform Capabilities
Explore Magic Insights, RCA Reports, Actions, and the Rubix Chat Agent.
Integrations
Connect GitHub, Slack, Datadog, PagerDuty, or build your own custom integrations.
Discover the Platform
Magic Insights
Shift from raw alerts to complete investigations with evidence-linked hypotheses.
Root Cause Analysis
Generate detailed, cited postmortems the moment an incident occurs.
Autonomous Action
Execute safe, scoped fixes with built-in blast radius calculations.
Talk to Your Infrastructure
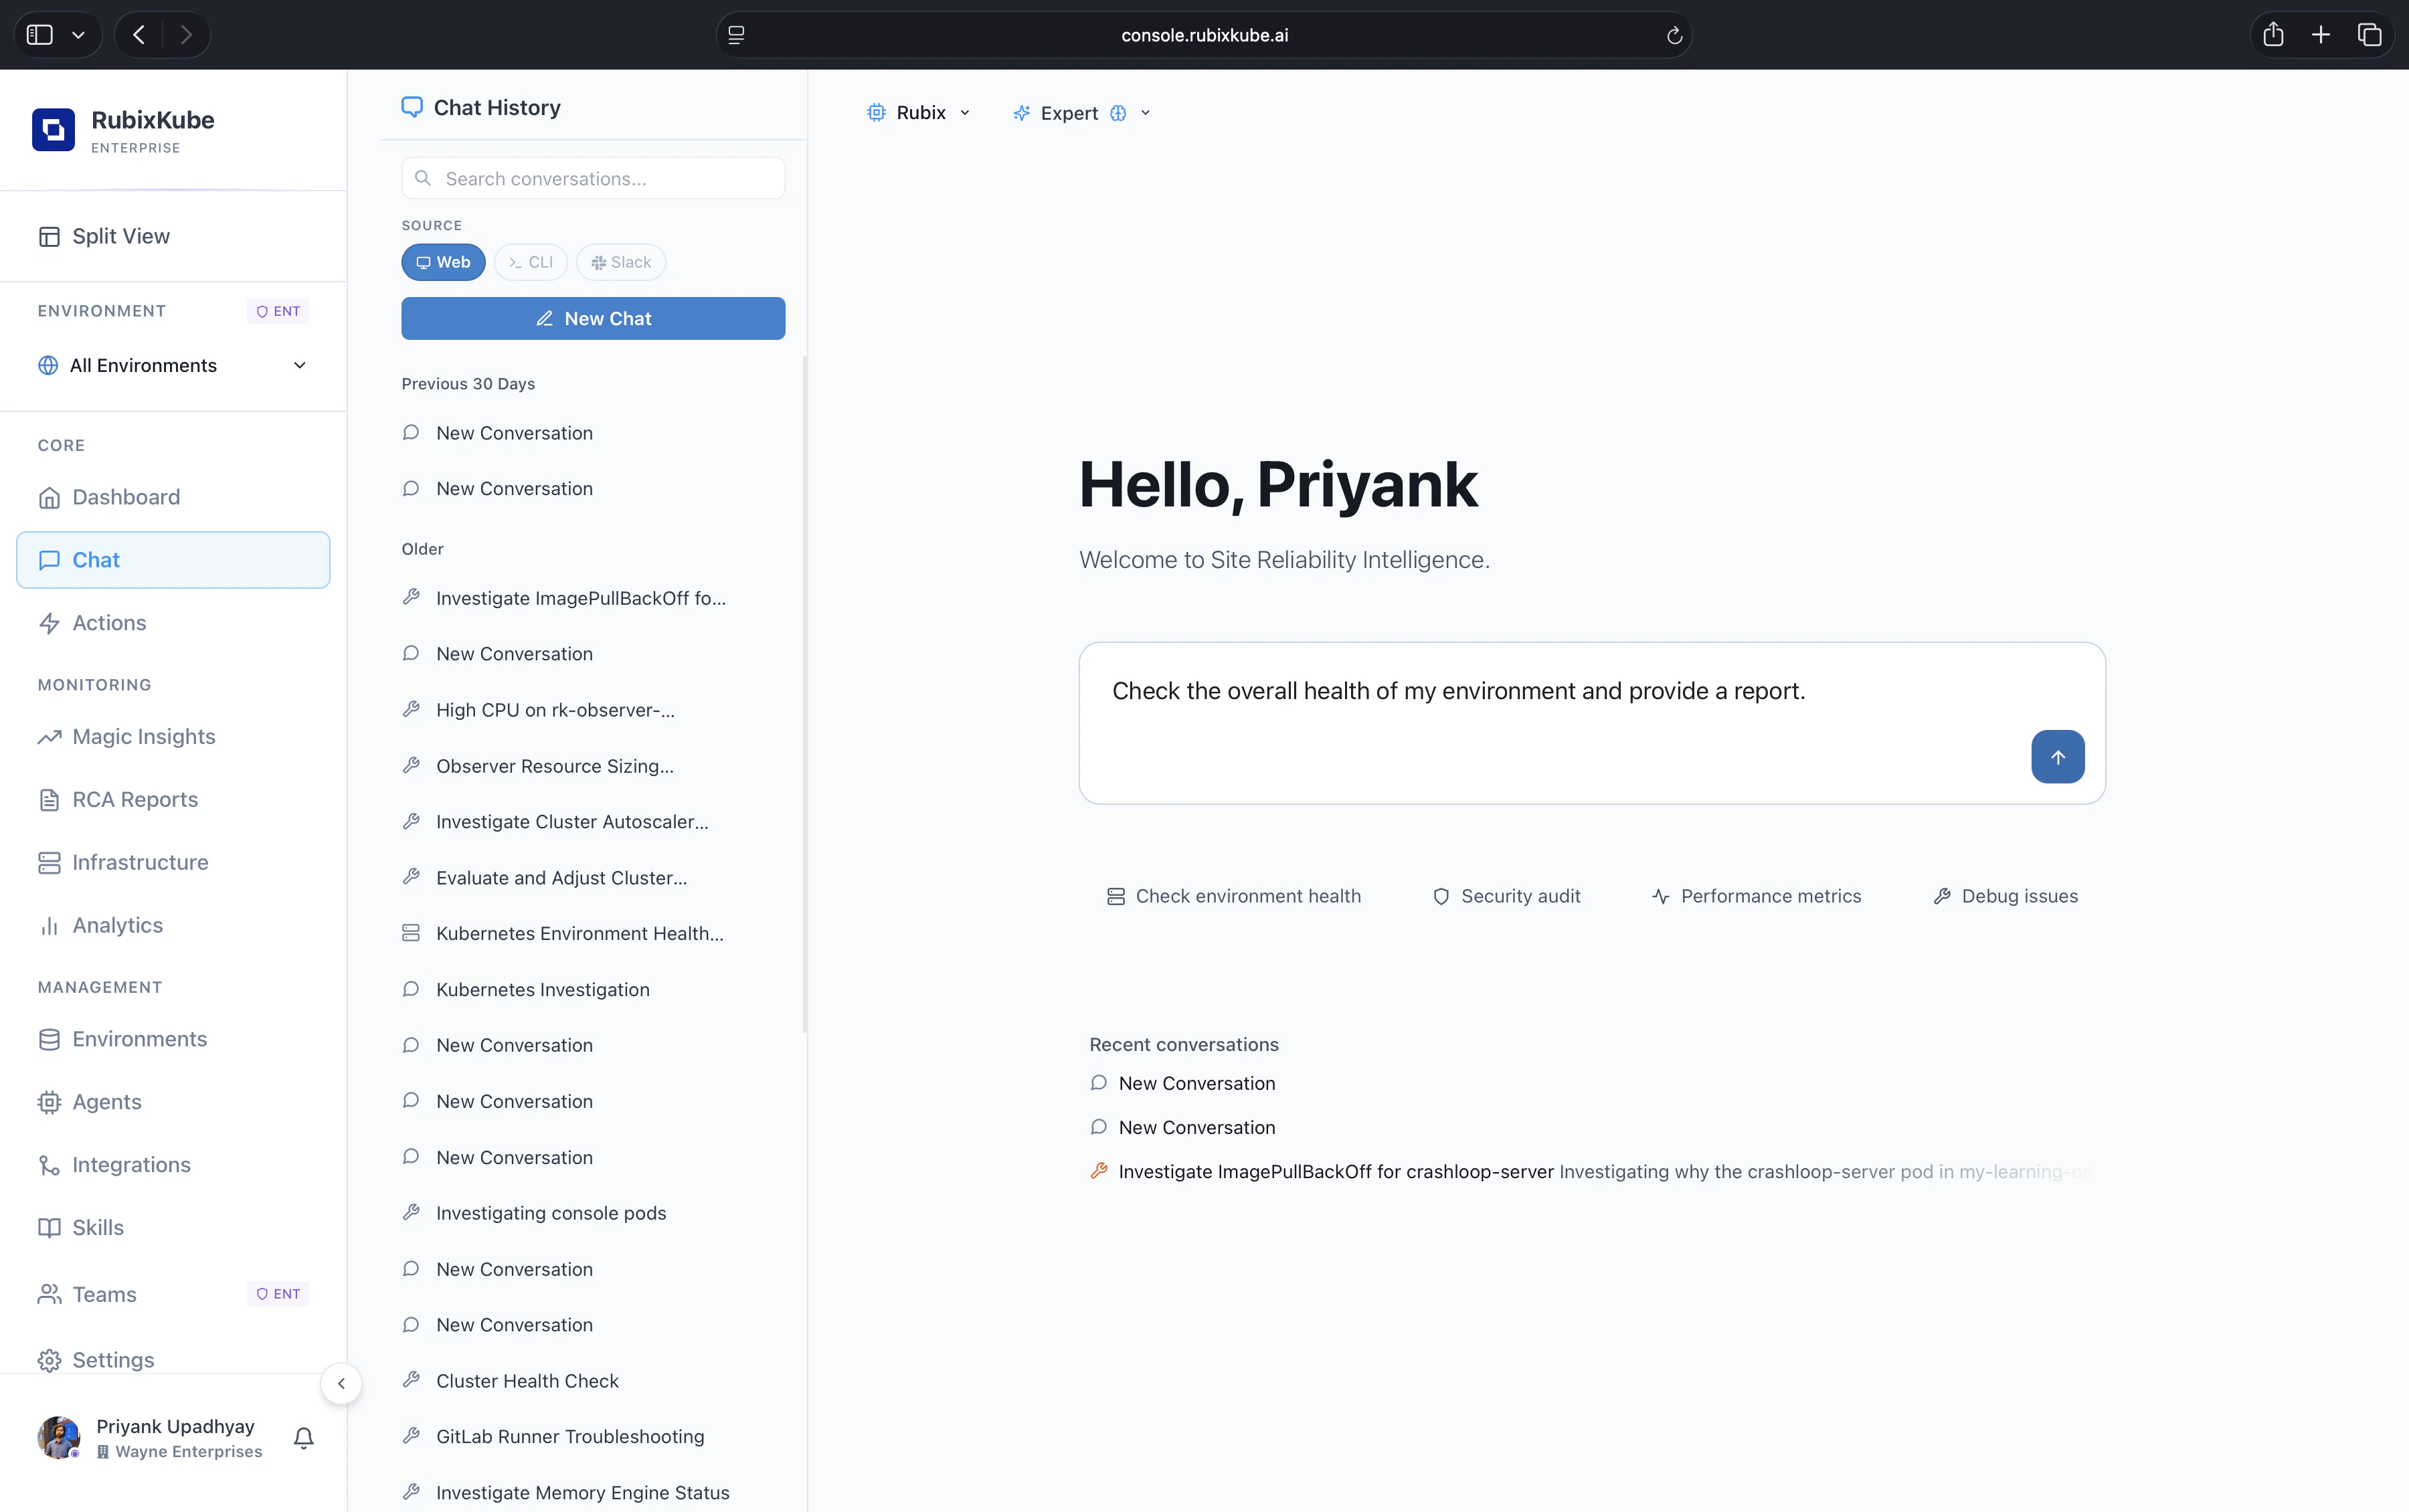
Chat Basics
Learn how to interact with the Rubix Chat Agent effectively.
Advanced Troubleshooting
Use chat to diagnose complex multi-service incidents.
Developer Tools
Rubix CLI
Manage environments, run investigations, and interact with the Agent Mesh directly from your terminal.
Custom Agent Skills
Extend RubixKube’s capabilities by writing custom tools for the agents to use.
Get Support
Need help or have questions? We are here to assist.Email Support
Reach out to our engineering team directly at connect@rubixkube.ai.
Join the Community
Check out our open-source projects, report issues, and contribute on GitHub.