

Troubleshooting with Chat: Real Incident Investigation
Now that you know Chat basics, let’s use it for what it does best:investigating real infrastructure problems . This tutorial shows you how to troubleshoot actual failing pods using the SRI Agent.Real scenarios ahead! We’ll investigate the 3 failing pods we deployed: broken-image-demo, memory-hog-demo, and crash-loop-demo. You’ll see actual Chat responses and learn the troubleshooting workflow.
The Troubleshooting Workflow
When something breaks, follow this Chat-powered workflow:Identify the Problem
Ask: “What’s failing?” or “Show me errors”
Get Details
Ask: “Why did [pod-name] fail?”
Understand Root Cause
Agent analyzes logs, events, and provides RCA
Get Fix Guidance
Ask: “How do I fix it?”
Verify Resolution
Ask: “Is [pod-name] healthy now?”
Scenario 1: Investigating OOMKilled Pod
The Problem
Thememory-hog-demo pod keeps crashing. Let’s use Chat to find out why.
Query: “Tell me about memory-hog-demo”
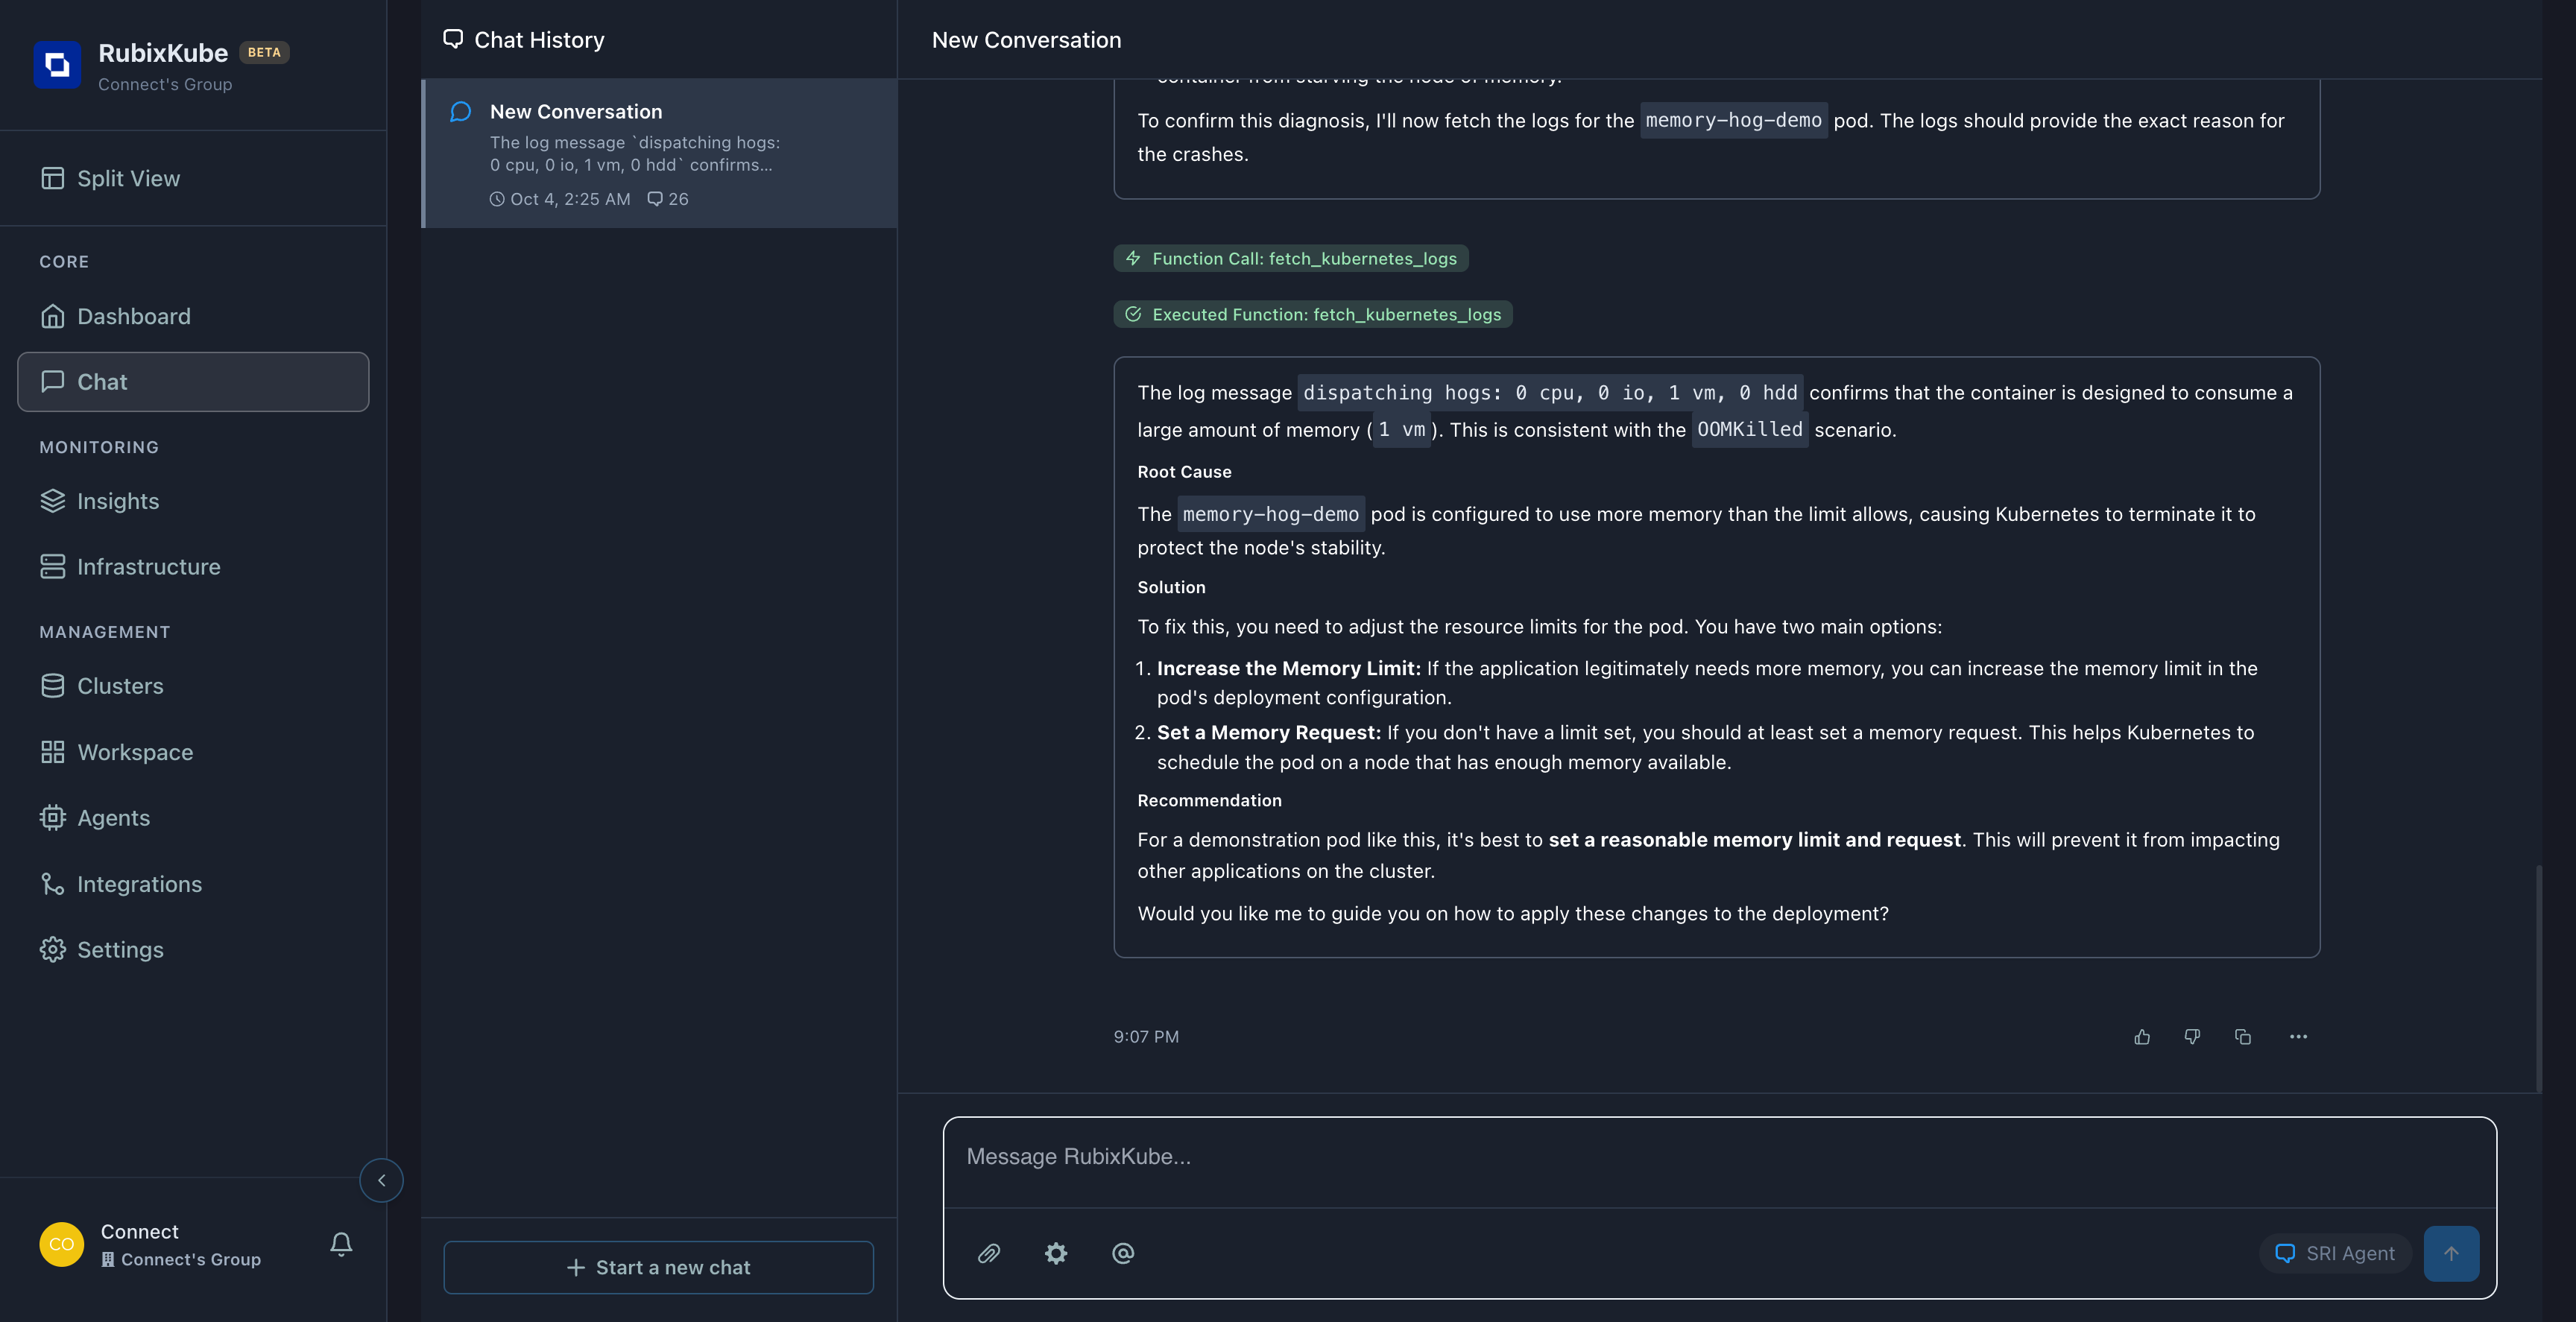
What the Agent Did
The SRI Agent automatically:Step 1: Fetched Pod Status
Step 1: Fetched Pod Status
Function Called:
fetch_kubernetes_graph_snapshotFound: - Pod: memory-hog-demo- Status:
CrashLoopBackOff - Restarts: 12 times
- Labels:
scenario: oomkilled
Step 2: Retrieved Logs
Step 2: Retrieved Logs
Function Called: Agent identified: Memory consumption pattern (1 vm = high memory usage)
fetch_kubernetes_logsLog Output:Step 3: Analyzed Root Cause
Step 3: Analyzed Root Cause
Root Cause (from Agent)
Thememory-hog-demo pod is configured to use more memory than the limit allows, causing Kubernetes to terminate it to protect the node’s stability.All this from ONE query! The agent:
- Fetched status (1 function call)
- Retrieved logs (1 function call)
- Analyzed the pattern
- Provided root cause
- Suggested fixes
Scenario 2: ImagePullBackOff Investigation
The Problem
Thebroken-image-demo pod won’t start.
Typical Questions to Ask
Expected Agent Response
The agent will:- Check pod status → Finds
ImagePullBackOff - Retrieve events → Sees failed pull attempts
- Identify issue → Non-existent registry
- Suggest fixes:
- Verify image name and tag
- Check registry accessibility
- Ensure image exists
- Review imagePullSecrets
Scenario 3: CrashLoopBackOff Analysis
The Problem
Thecrash-loop-demo pod starts, then immediately crashes.
Query: “Why is crash-loop-demo crashing?”
Expected workflow:
1
Agent Fetches Pod Status
Finds:
CrashLoopBackOff with high restart count2
Agent Retrieves Logs
Looks for error messages in container logs
3
Agent Checks Exit Code
Exit code 1 = application error (not OOMKilled or signal)
4
Agent Provides Guidance
- Check application logs for errors
- Verify configuration
- Check for missing dependencies
- Review startup command
Common CrashLoop Causes
The agent can identify:Multi-Pod Investigation
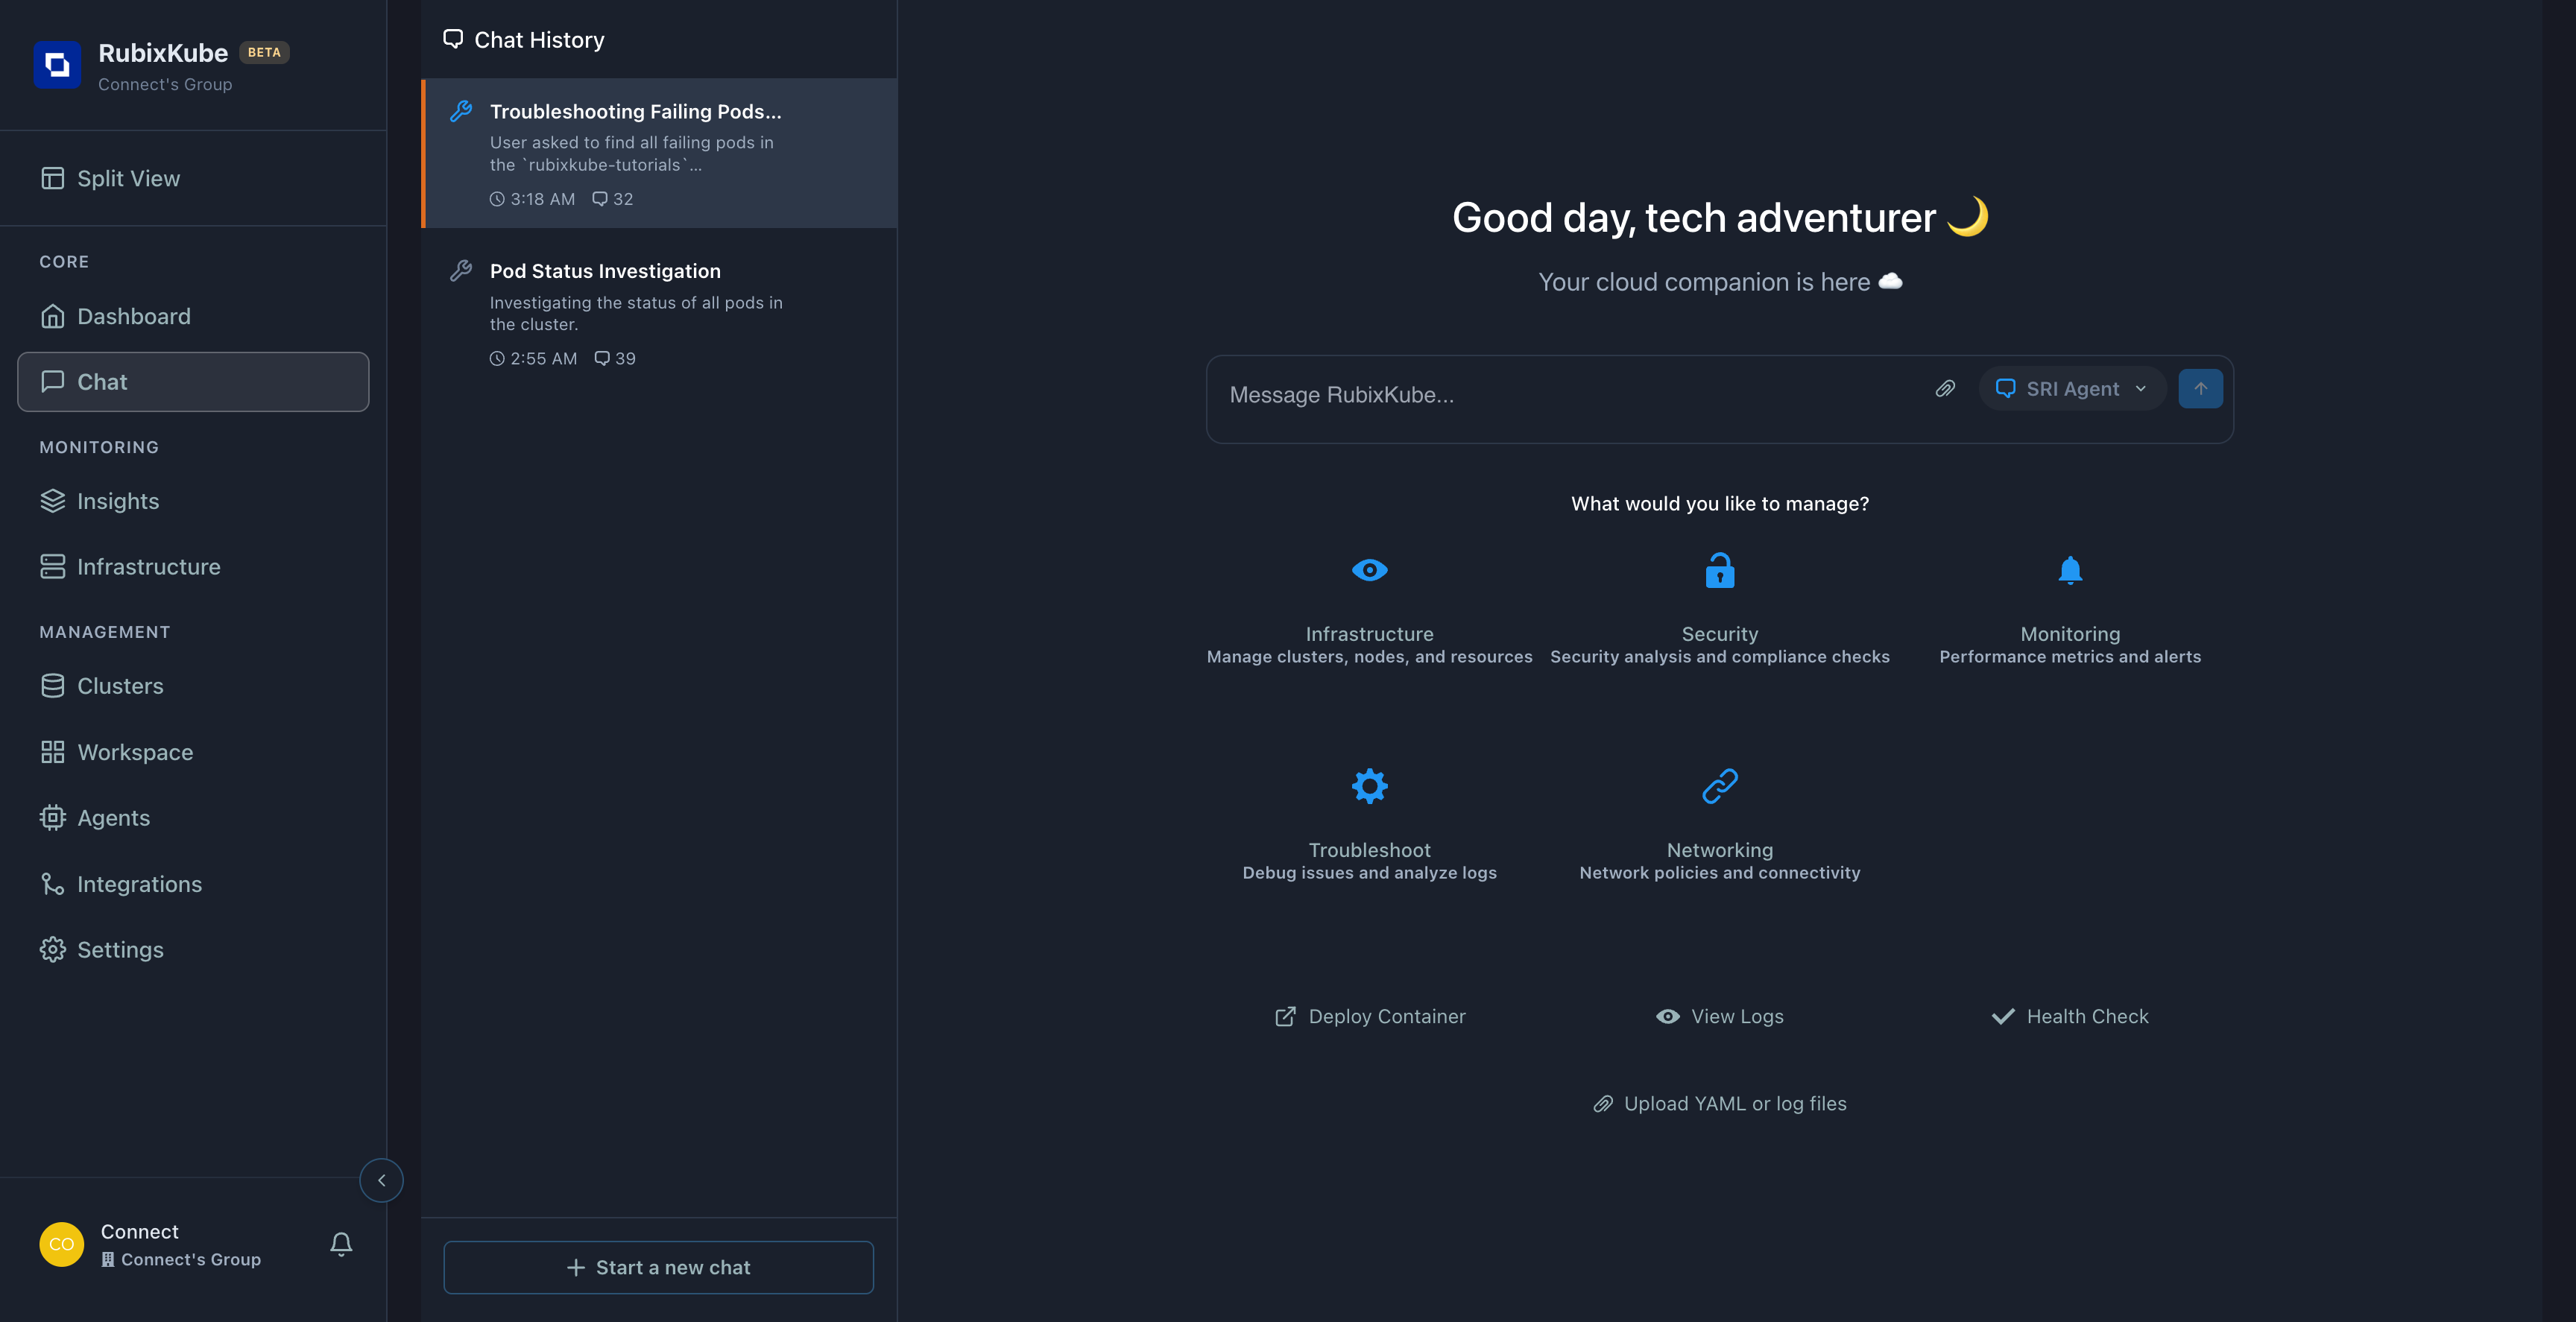
Query: “Show me all failing pods in rubixkube-tutorials”
This query attempts to get an overview of ALL problems at once.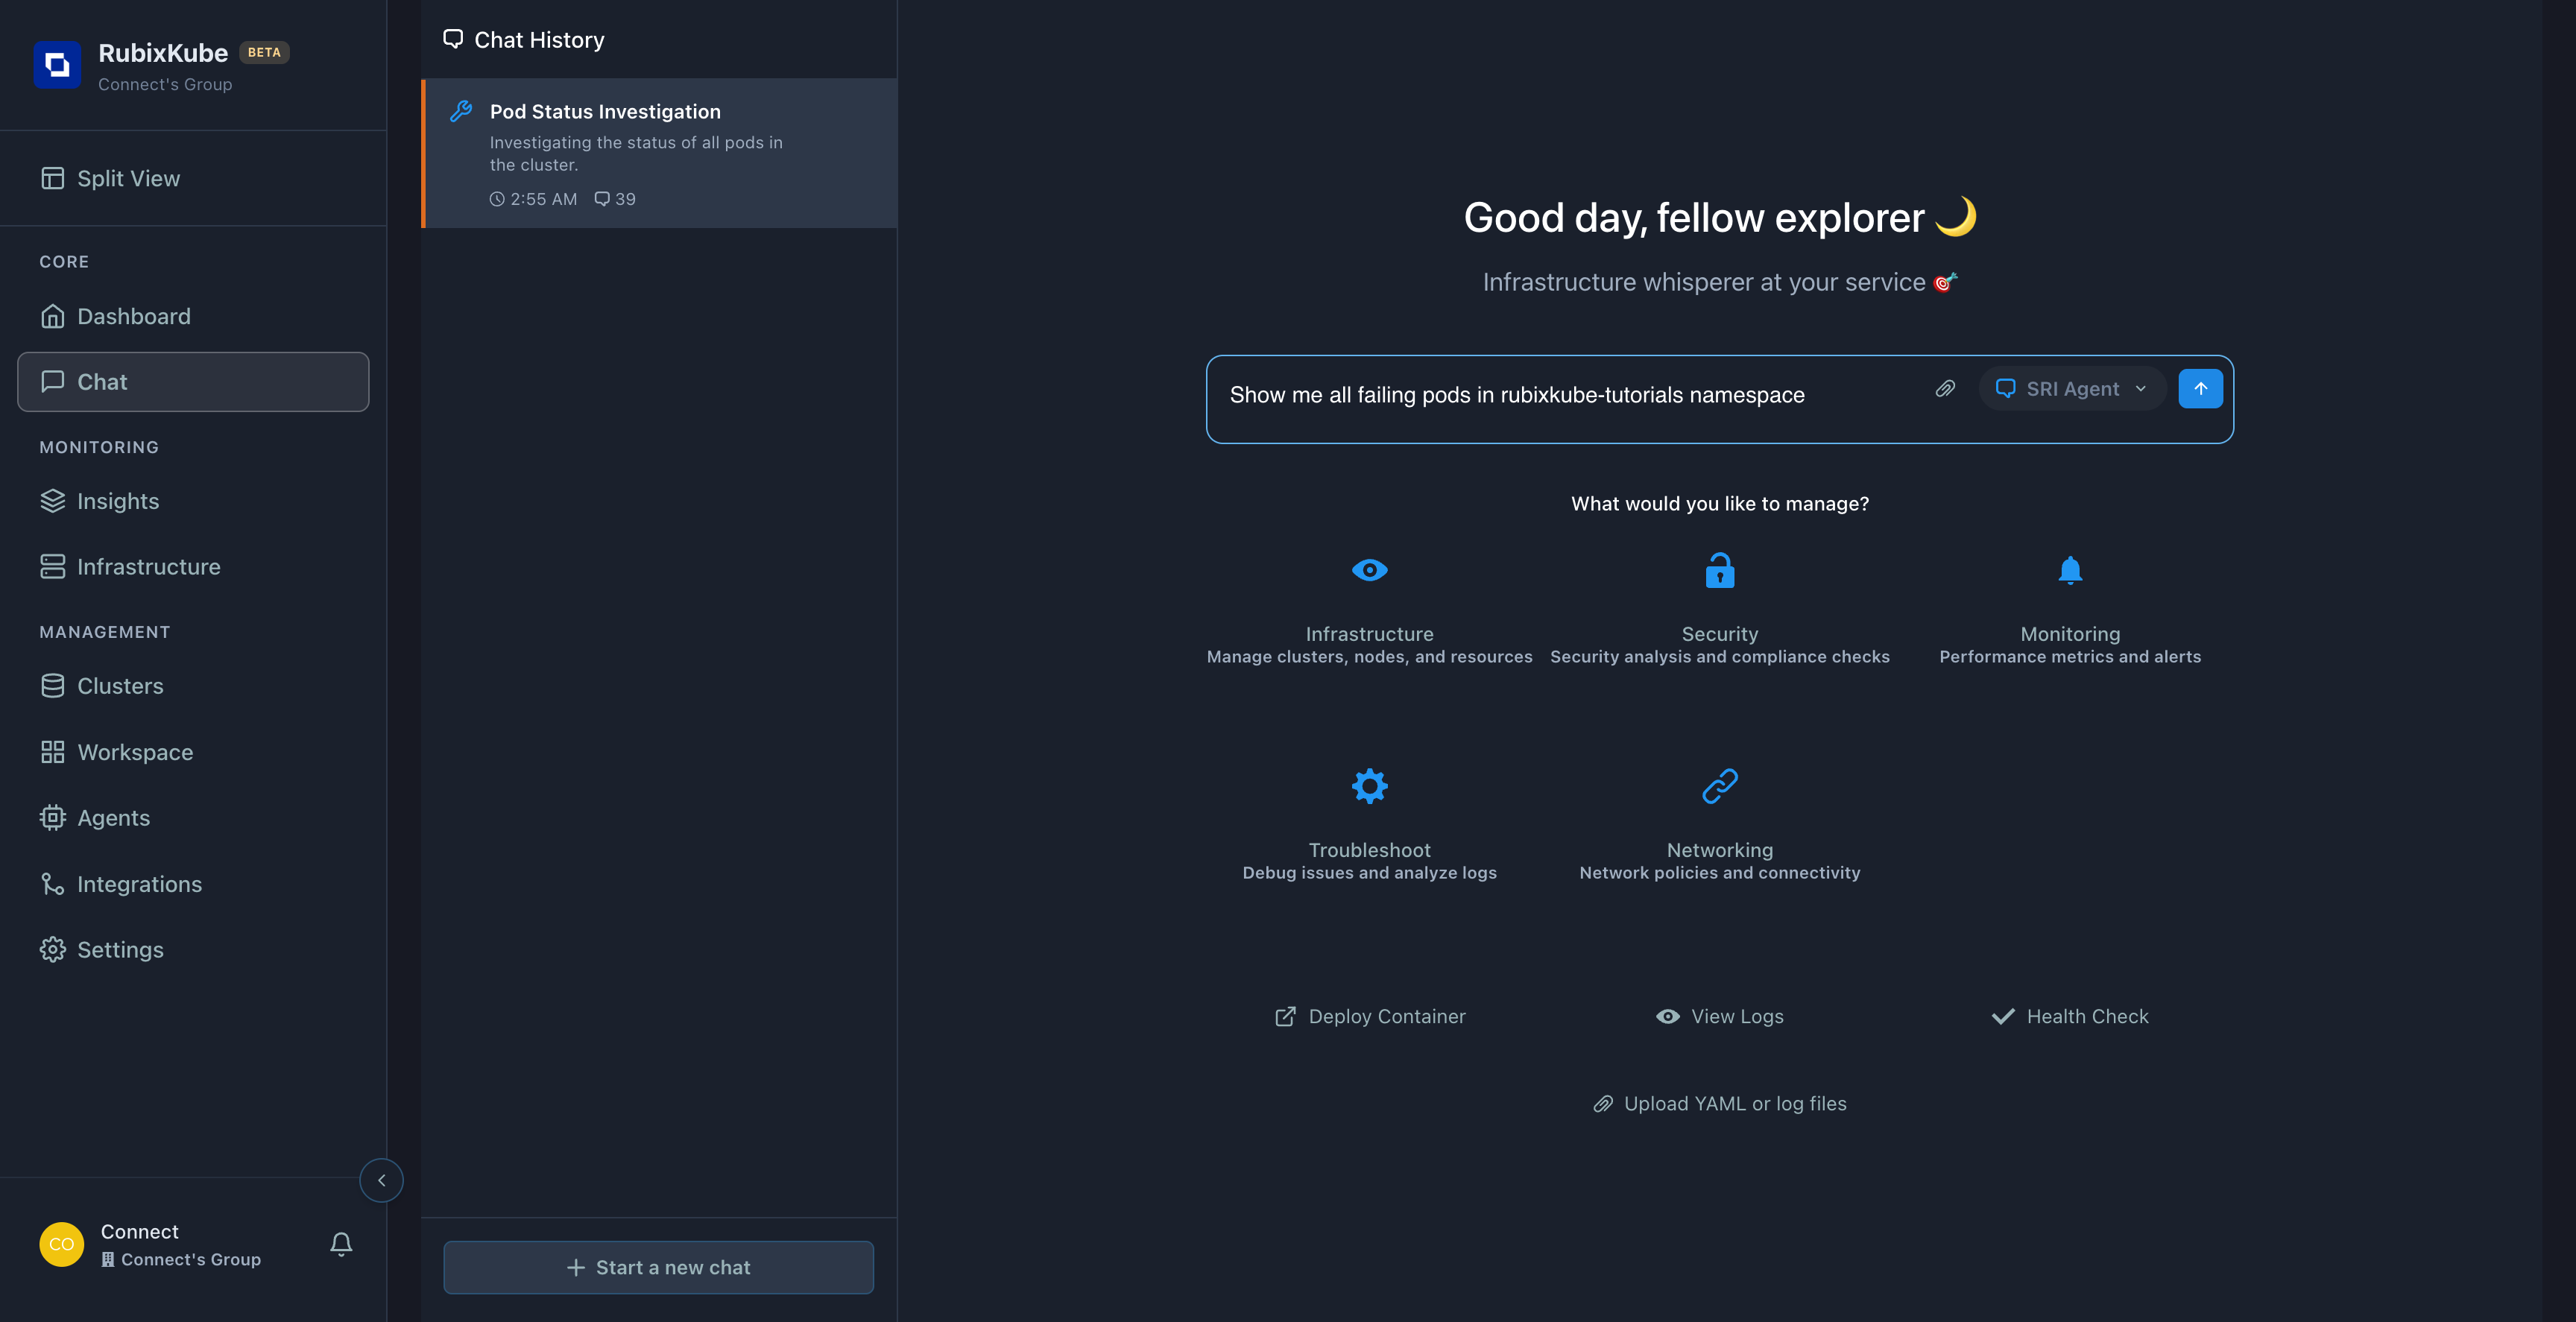
Agent’s approach:
1
Thought: Querying Kubernetes Pods
Agent plans to fetch all pods in the namespace
2
Function Call: fetch_kubernetes_graph_snapshot
Queries Kubernetes API for pod data
3
Thought: Identifying Failed Pods
Filters for non-Running/non-Healthy statuses
4
Response
Lists all failing pods with their statuses
Agent Response:
The agent successfully identified all 3 failing pods: 1.broken-image-demo - Status: Pending, Reason: ImagePullBackOff
2.crash-loop-demo - Status: CrashLoopBackOff, Restarts: 142
3.memory-hog-demo - Status: CrashLoopBackOff, Restarts: 142 (OOMKilled)
Following Up on Incidents
Once you have the list, drill down:Example conversation flow:
Context is KEY! The agent tracks the conversation. You don’t need to repeat pod names or namespaces.
Asking for Logs
Query:"Show me logs for memory-hog-demo"
What the agent does: 1. Calls fetch_kubernetes_logs
2. Retrieves recent log lines
3. Highlights ERROR or WARN messages
4. Provides context about what logs mean
Example response:
Comparing Traditional vs. Chat Troubleshooting
Traditional Approach (Without Chat)
Step-by-step for OOMKilled investigation:
kubectl get pods -n rubixkube-tutorials→ Find failing podkubectl describe pod memory-hog-demo -n rubixkube-tutorials→ See eventskubectl logs memory-hog-demo -n rubixkube-tutorials→ Check logskubectl get pod memory-hog-demo -n rubixkube-tutorials -o yaml→ Review config- Google “OOMKilled kubernetes”
- Read Stack Overflow
- Try increasing memory limit
kubectl apply -f fixed-pod.yamlkubectl get pod memory-hog-demo -n rubixkube-tutorials→ Verify
Chat Approach
Single query:"Why is memory-hog-demo crashing?"
Agent does ALL of the above automatically: - Gets pod status
- Checks events
- Retrieves logs
- Reviews configuration
- Identifies OOMKilled pattern
- Explains root cause
- Provides fix with exact kubectl command
Time: 1-2 minutes
Time Saved
** 85-90%** faster with Chat
Steps Saved
** 9 manual steps** → 1 question
When Chat Needs Clarification
Sometimes the agent needs more information. This is GOOD - it means it’s being careful.Example: Namespace Not Specified
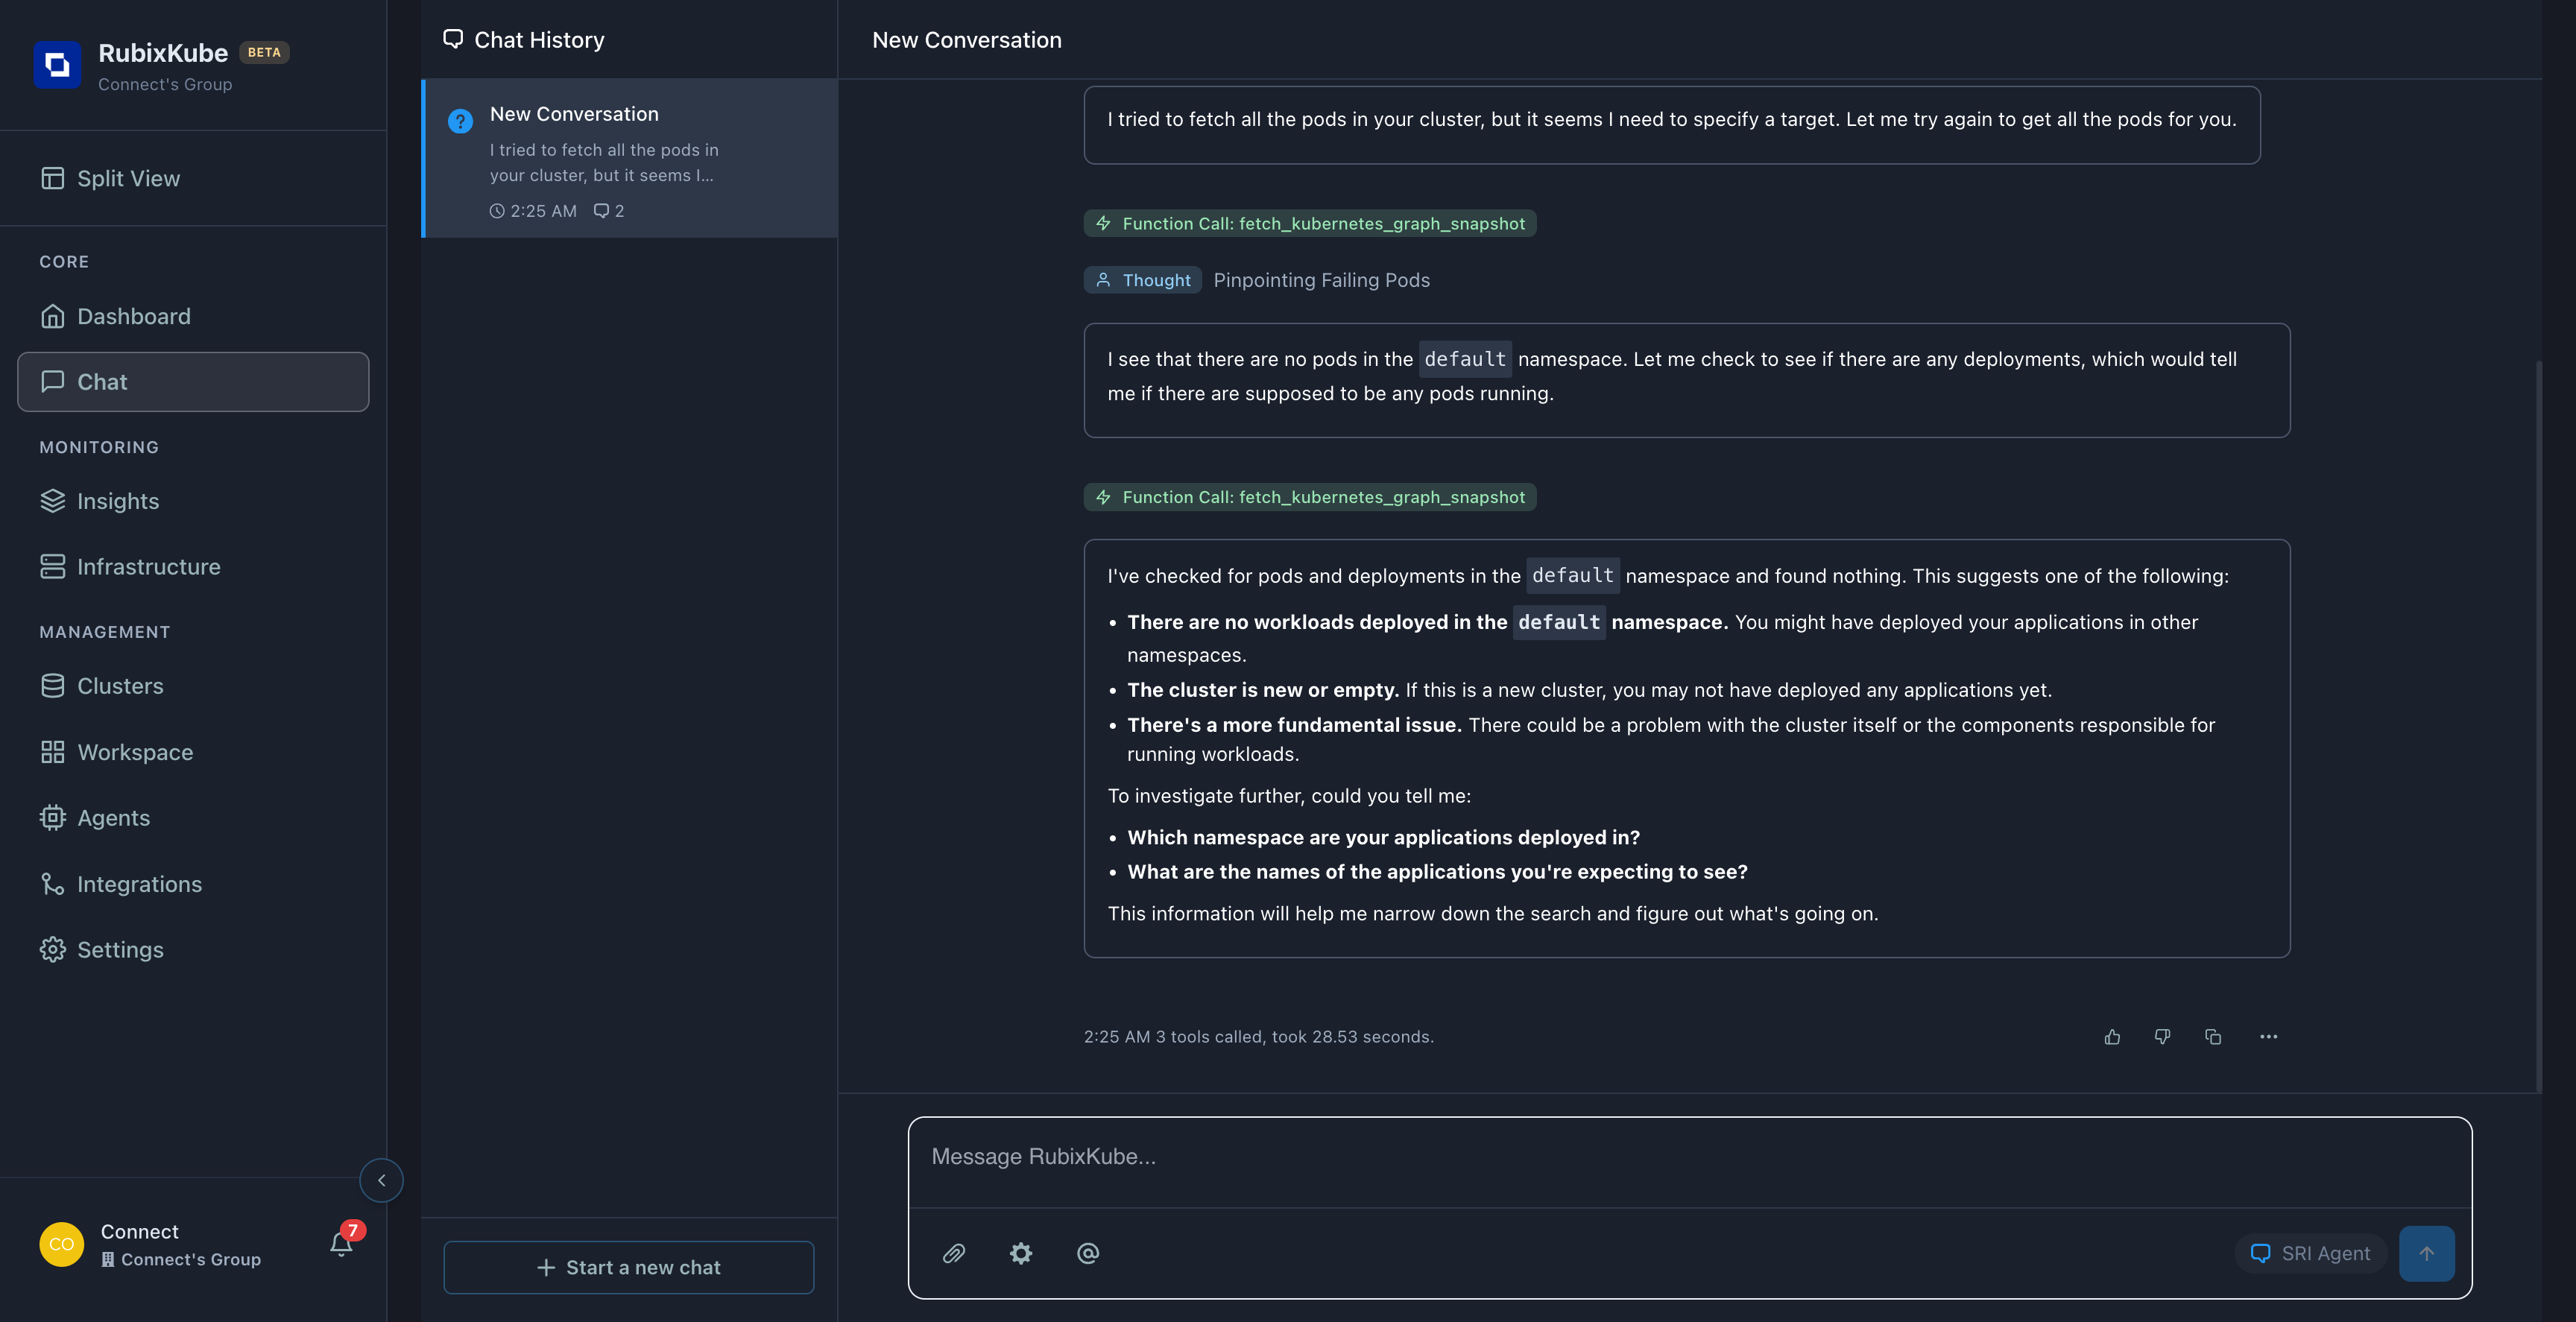
"Show me failing pods"
Agent Response: > “I checked the default namespace and found nothing. Which namespace are your applications in?”
Your follow-up: "Check rubixkube-tutorials"
Agent: "Of course! I'll check that namespace for you."
Advanced Troubleshooting Queries
Resource Analysis
Event Timeline
Historical Context
Common Troubleshooting Queries
- Pod Failures
- Performance Issues
- Log Analysis
- Event Investigation
Queries:You will get:
- Pod status
- Error messages
- Root cause analysis
- Fix suggestions
Real Example: Complete Investigation
Here’s a REAL conversation troubleshootingmemory-hog-demo:
The Full Exchange
Query 1:"What pods are failing in my cluster?"
Agent: Asks which namespace to check
Query 2:
"Check rubixkube-tutorials namespace"
Agent: Investigates that namespace
Query 3:
"memory-hog-demo"
Agent Response:
- Function Call:
fetch_kubernetes_graph_snapshot - Found: CrashLoopBackOff, 12 restarts
- Function Call:
fetch_kubernetes_logs - Log analysis: memory consumption pattern
- Root Cause: Memory limit too low
- Solution: Increase limit to 150Mi
"How do I fix it?"
Agent: Provides exact kubectl commands
Tips for Effective Troubleshooting
Start Broad
“What’s failing?” → Get overviewThen narrow: “Tell me about [specific pod]”
Ask for Evidence
“Show me the logs”“What events occurred?”Agent provides proof
Request Root Cause
“Why did this happen?”Agent analyzes patterns
Get Step-by-Step Fix
“How do I fix it?”Agent provides kubectl commands
Understanding Error Types
OOMKilled (Out of Memory)
How to ask:- Actual memory attempted
- How much over the limit
- Recommended new limit
ImagePullBackOff
How to ask:- Registry URL
- Error message (auth, not found, network)
- Common fixes for each scenario
CrashLoopBackOff
How to ask:- Log errors
- Restart count and pattern
- Likely causes (config, bug, dependency)
Following the RCA
When the agent provides analysis, you can dig deeper:Example conversation:
Time Savings: Real Numbers
Based on our testing with 3 different pod failures:Average: 87% time saved
And that’s just for detection + diagnosis . Chat also:- Provides the fix immediately
- No Googling required
- No trial and error
- Learn while you troubleshoot
What You Learned
Troubleshooting Workflow
5-step process from detection to resolution
Real Investigation
Actual OOMKilled pod analysis with agent reasoning
Error Types
How to investigate OOMKilled, ImagePullBackOff, CrashLoop
Context Usage
How to have multi-turn troubleshooting conversations
Time Savings
87% faster than traditional debugging
Function Transparency
What each function call does and why
Next: Advanced Chat Usage
You’ve mastered troubleshooting! Now learn advanced techniques:Continue: Advanced Chat Features
Learn about personas, workflows, file uploads, and power user tips
Quick Reference
Fastest troubleshooting query:Need Help?
Support
Email: connect@rubixkube.ai
Understand RCA
How Root Cause Analysis works under the hood.