Your First 15 Minutes with RubixKube
Welcome! You’ve installed RubixKube and connected your cluster. Now let’s explore the interface and see what RubixKube can do. This tutorial takes about ** 15 minutes** and gives you a solid foundation.Prerequisites: - RubixKube account created
- Observer agent installed on your cluster (KIND or cloud)
- Logged into console.rubixkube.ai
Step 1: Understanding the Dashboard
After logging in, you’ll land on the Dashboard - your command center for infrastructure reliability.
Main Metrics at a Glance
The dashboard shows 4 key metrics:System Health
100% = Healthy
Overall health of your infrastructure based on pod status, resource usage, and incident historyActive Insights
Number of issues detected
Current problems RubixKube has identified that need attention (pods failing, resource issues, etc.)Intelligent Analysis
RCA Reports generated
Root Cause Analysis reports created by the RCA Pipeline AgentAgents
3/3 Active
Status of AI agents monitoring your cluster (Observer, RCA Pipeline, Memory, SRI)Step 2: Check Your Cluster Connection
Scroll down to the Infrastructure panel to verify your cluster is connected: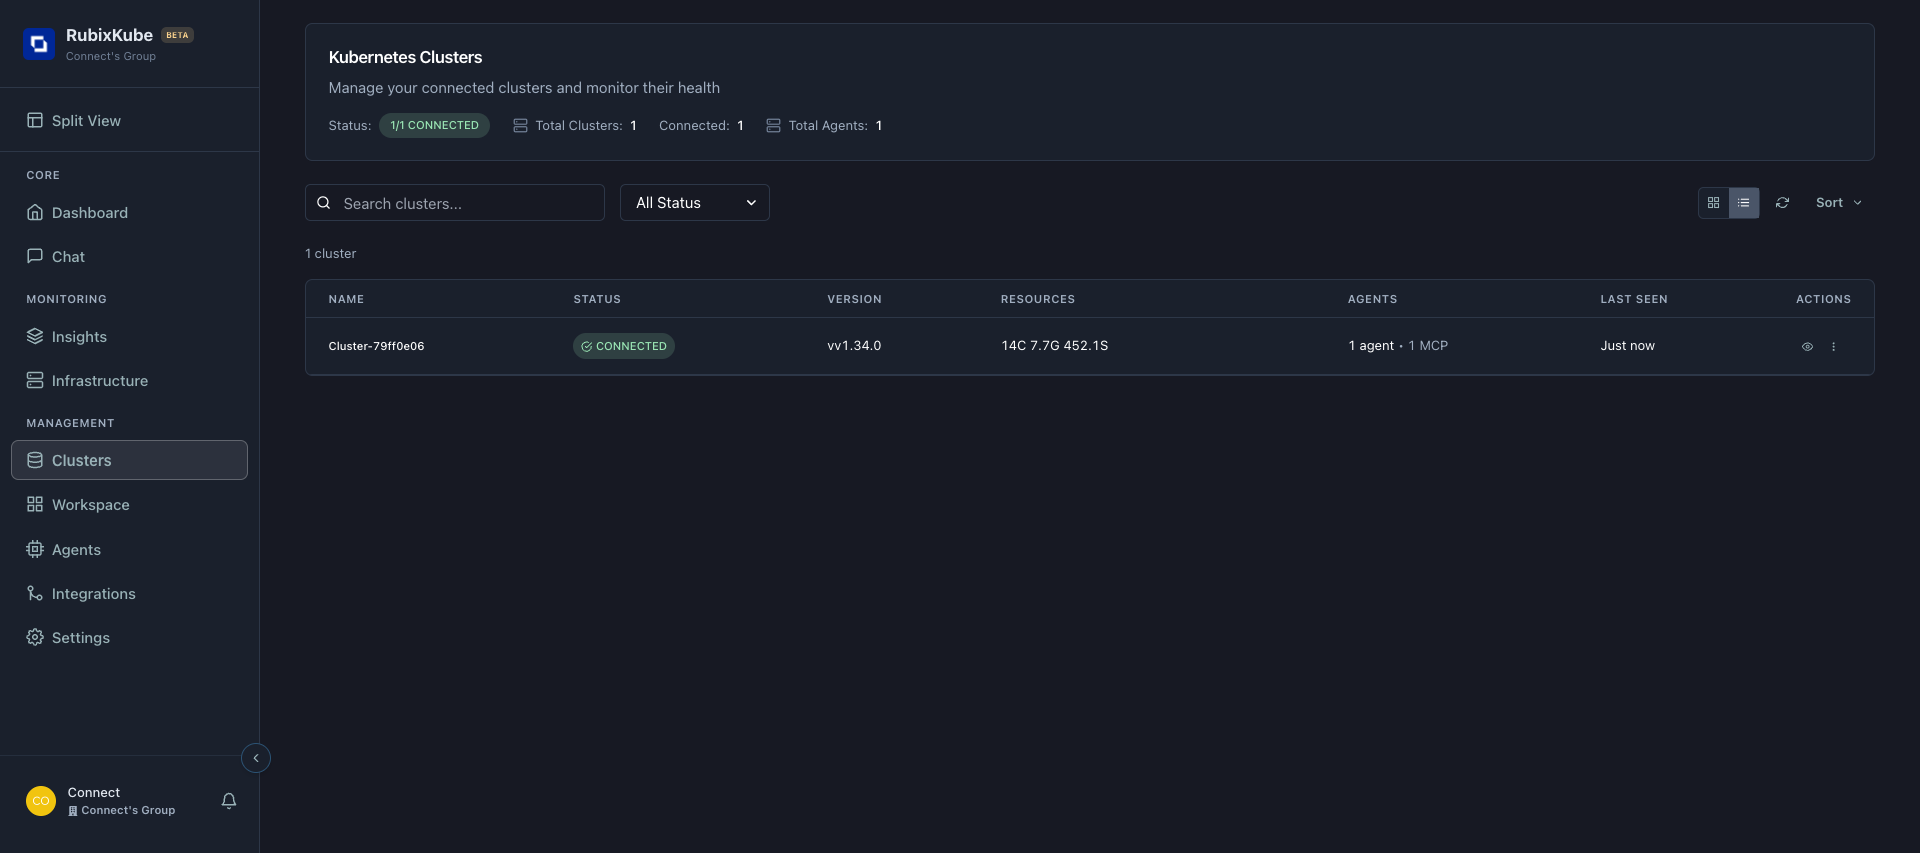
- Node count - How many nodes in your cluster
- Pod count - Total pods running
- Deployments - Number of deployments
- Services - Exposed services
Step 3: Explore the Navigation
RubixKube’s interface is organized into logical sections:Core Section
Dashboard
Dashboard
What: Overview of system health and recent activity
When to use: Daily check-in, incident triage
Key info: Metrics, insights, activity feed
When to use: Daily check-in, incident triage
Key info: Metrics, insights, activity feed
Chat
Chat
What: Conversational interface with SRI Agent
When to use: Query your infrastructure using natural language
Try asking: “What pods are failing?” or “Show me memory usage”
When to use: Query your infrastructure using natural language
Try asking: “What pods are failing?” or “Show me memory usage”
Monitoring Section
Insights
Insights
What: Detailed view of all detected issues
When to use: Investigate specific incidents
Shows: Incident details, RCA analysis, suggestions
When to use: Investigate specific incidents
Shows: Incident details, RCA analysis, suggestions
Infrastructure
Infrastructure
What: Topology and resource visualization
When to use: Understand service dependencies
Shows: Infrastructure graph, resource relationships
When to use: Understand service dependencies
Shows: Infrastructure graph, resource relationships
Management Section
Clusters
Clusters
What: List of connected Kubernetes clusters
When to use: Manage multi-cluster setups
Shows: Cluster health, version, resources
When to use: Manage multi-cluster setups
Shows: Cluster health, version, resources
Agents
Agents
What: Status of all AI agents
When to use: Verify agents are active and healthy
Shows: Agent list, capabilities, last activity
When to use: Verify agents are active and healthy
Shows: Agent list, capabilities, last activity
Workspace
Workspace
What: Custom dashboards and visualizations
When to use: Create personalized views
Status: Beta feature, coming soon
When to use: Create personalized views
Status: Beta feature, coming soon
Integrations
Integrations
What: Third-party tool connections
When to use: Configure Slack, Prometheus, etc.
Shows: 17 available integrations
When to use: Configure Slack, Prometheus, etc.
Shows: 17 available integrations
Settings
Settings
What: Organization and user configuration
When to use: Update profile, preferences, API settings
Tabs: Organization, Preferences, System, Security
When to use: Update profile, preferences, API settings
Tabs: Organization, Preferences, System, Security
Step 4: View Active Agents
Navigate to Agents to see your AI team: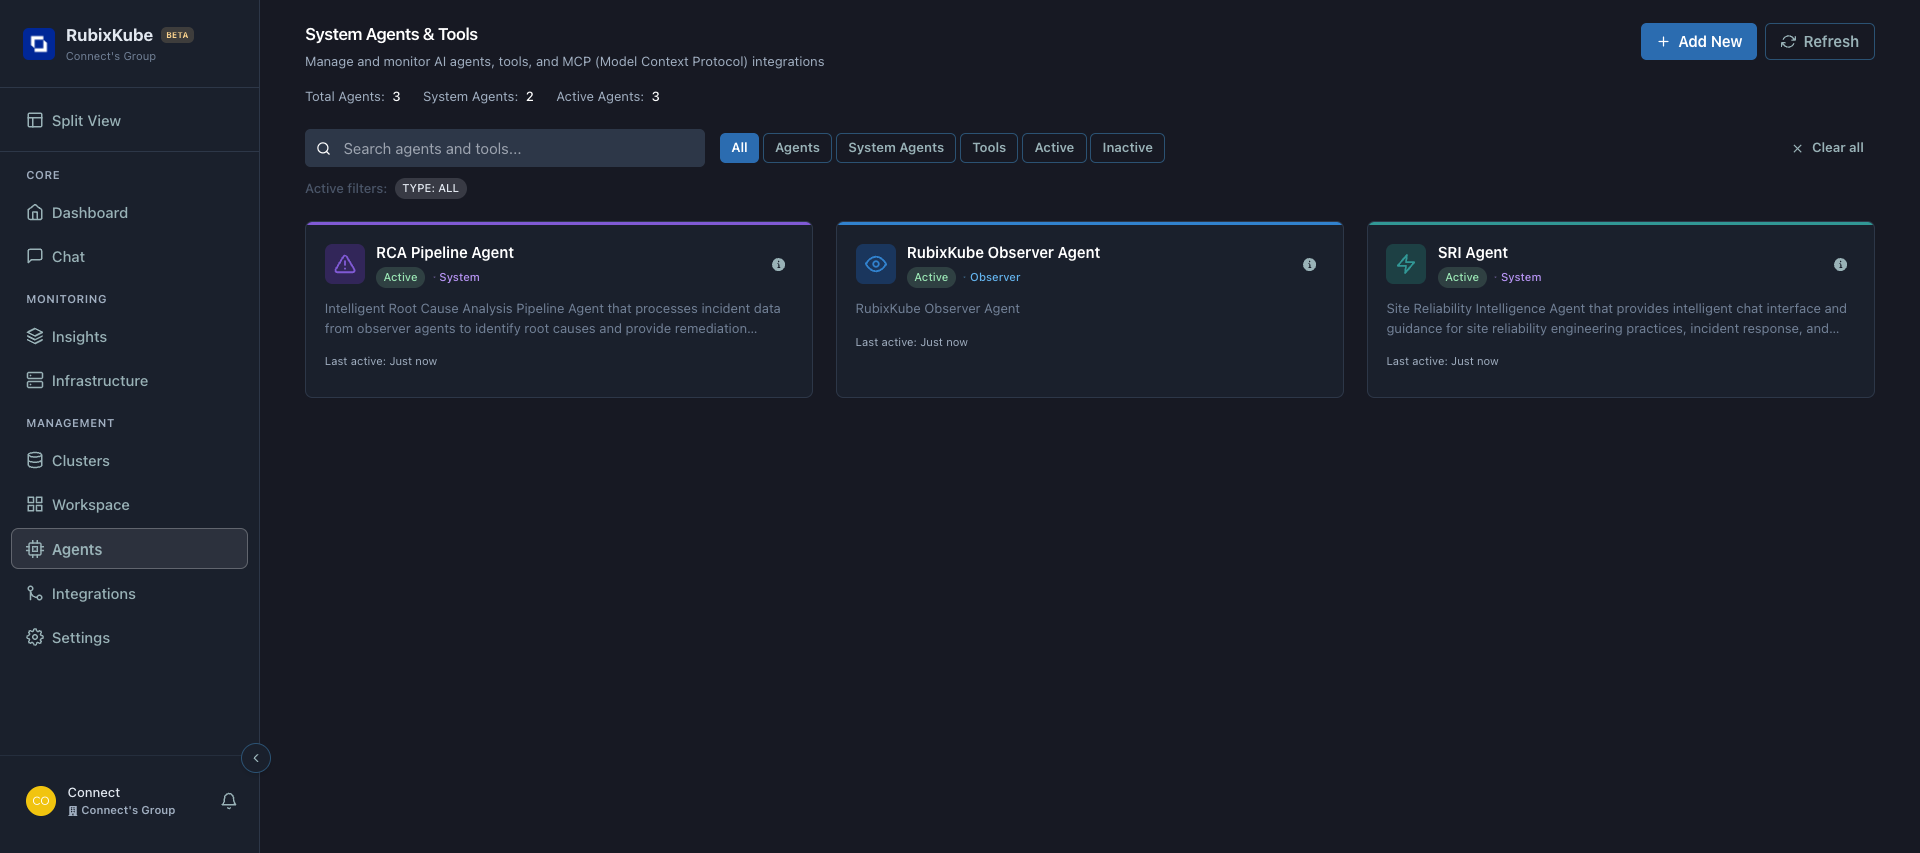
You should see 3 active agents:
| Agent | Role | Status |
|---|---|---|
| RCA Pipeline Agent | Analyzes incidents and generates root cause reports | Active |
| RubixKube Observer Agent | Monitors your cluster continuously | Active |
| SRI Agent | Provides conversational interface via Chat | Active |
All agents active = RubixKube is fully operational! They work together to detect, analyze, and help you resolve issues.
Step 5: Try the Chat Interface
Click Chat in the navigation to access the conversational interface: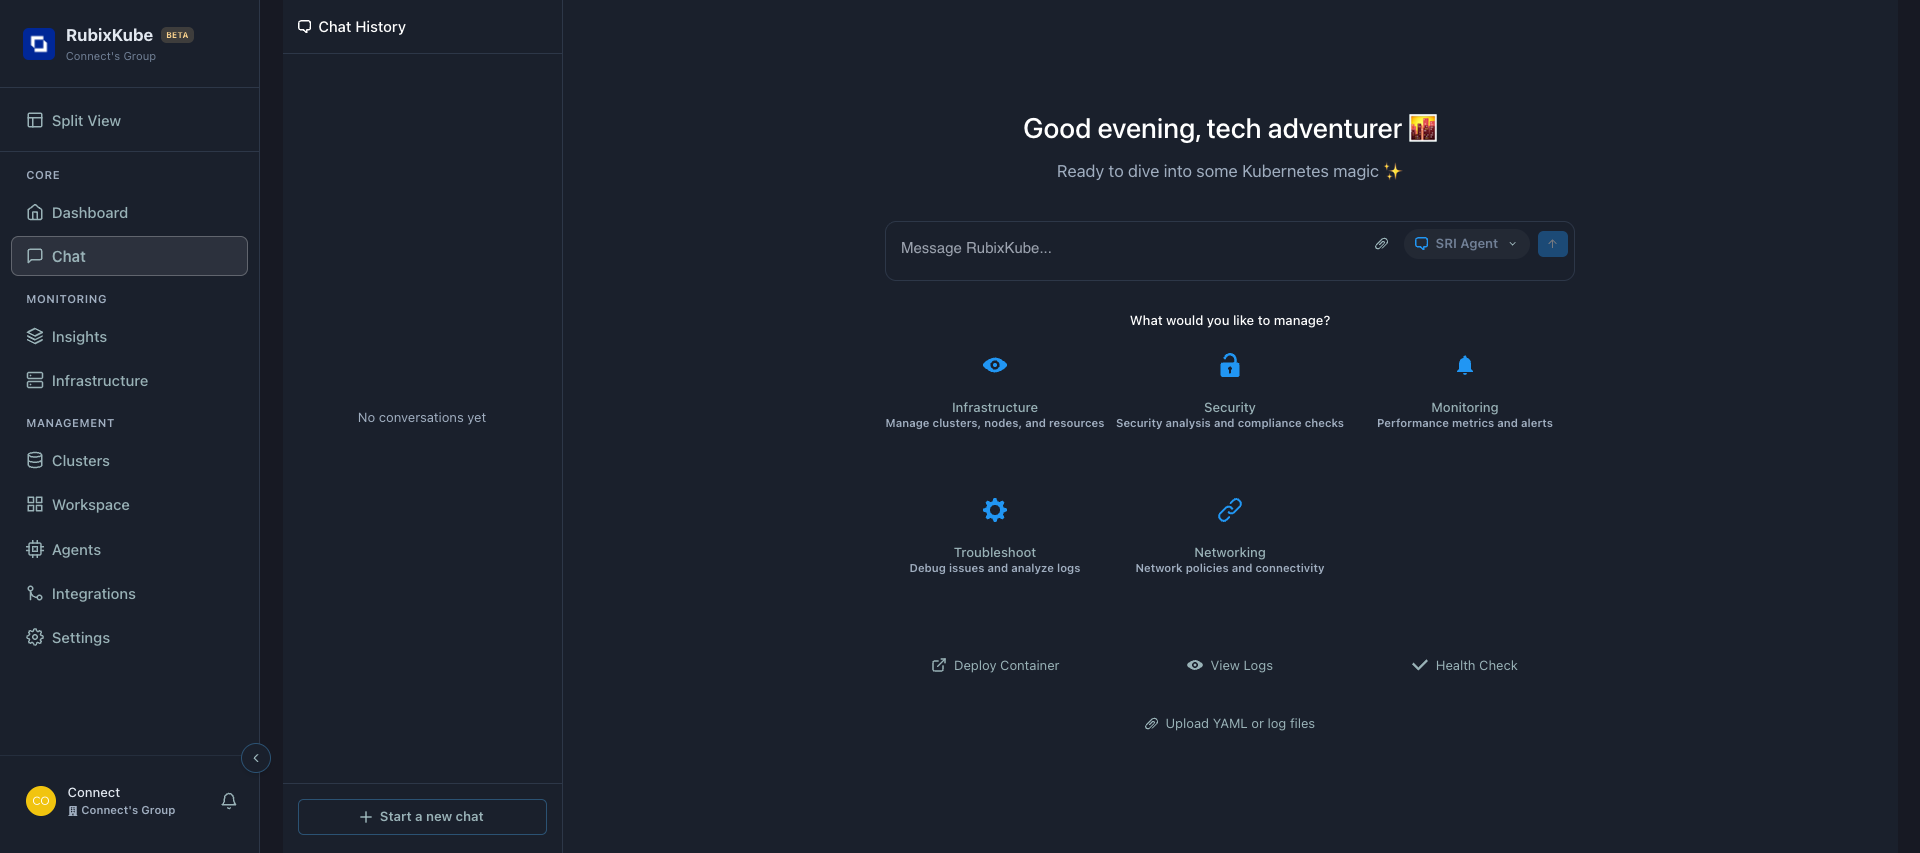
Quick Actions Available
The Chat interface offers pre-built action categories:Infrastructure
Manage clusters, nodes, and resources
Security
Security analysis and compliance checks
Monitoring
Performance metrics and alerts
Troubleshoot
Debug issues and analyze logs
Networking
Network policies and connectivity
Try Your First Query
Type a question in the chat box: Example queries to try: ``` “What pods are running in my cluster?” “Show me any failing pods” “What’s the memory usage across all pods?” “Are there any recent events I should know about?”Activity Feed is live - it updates in real-time as RubixKube detects issues. No refresh needed!
Step 7: Check the RCA Live Stream
The RCA Live Stream shows the RCA Pipeline Agent working in real-time: What you’ll see: - Function calls being made- Analysis in progress
- Evidence gathering
- Pattern matching
This is the AI at work!
What does 'RCA_IN_PROGRESS' mean?
What does 'RCA_IN_PROGRESS' mean?
When RubixKube detects an incident, the RCA Pipeline Agent immediately starts analyzing:1.Gathering evidence - Logs, metrics, events
2.Correlating data - Finding relationships
3.Identifying root cause - Determining what went wrong
4.Generating suggestions - Proposing fixesThis usually takes ** 30-90 seconds** . You’ll see the progress percentage.
Step 8: Explore Settings
Navigate to Settings to configure your RubixKube instance: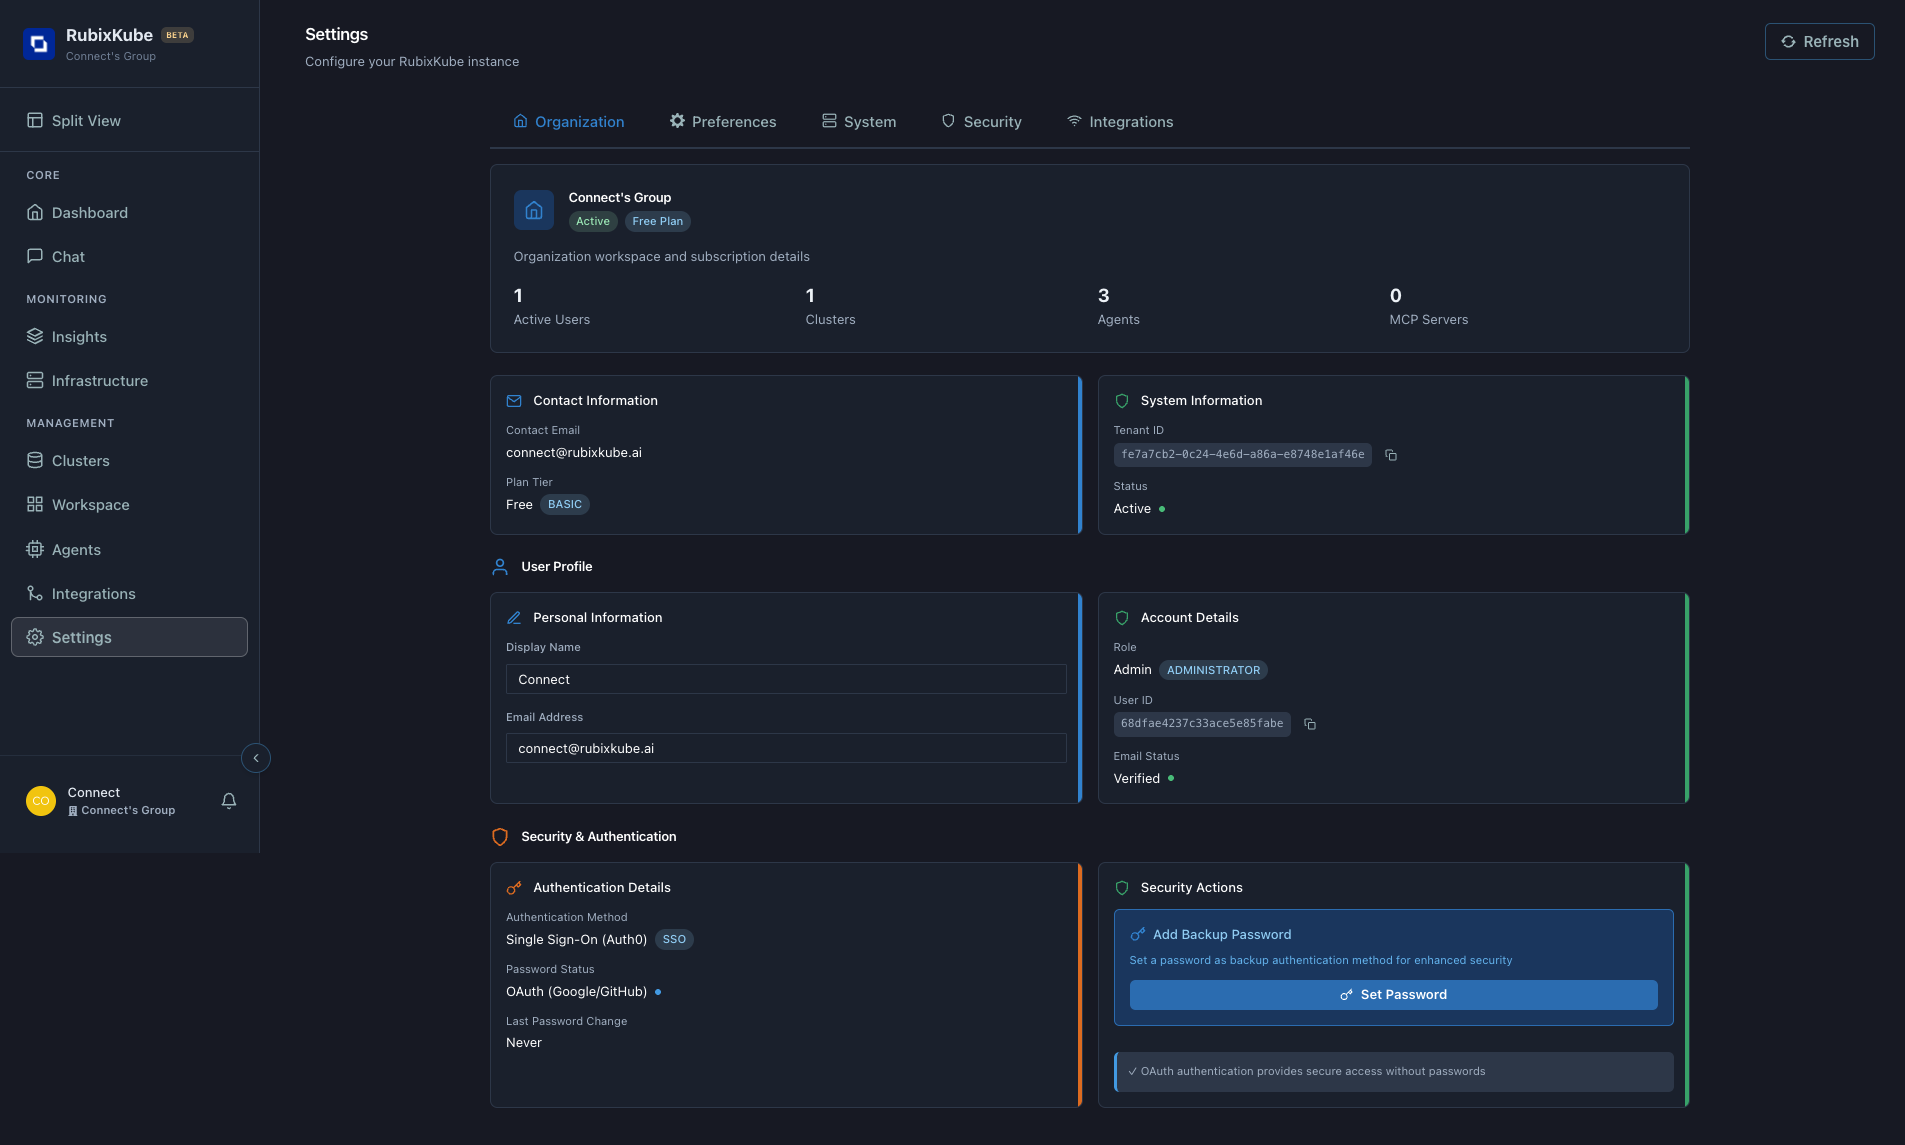
Available tabs:
- Organization
- Preferences
- System
- Security
- Integrations
- Workspace name and plan
- Active users and clusters
- Contact information
- User profile details
- Account role and permissions
What You’ve Learned
After these first steps, you now know:Dashboard Navigation
How to navigate RubixKube’s interface and find what you need
Key Metrics
What System Health, Insights, and Agents mean
Chat Interface
How to query your infrastructure using natural language
Agent System
Which AI agents are monitoring your cluster
Next Steps
Now that you understand the basics, try these tutorials:Detect ImagePullBackOff
See how RubixKube detects container image issues
Detect OOMKilled Pods
Watch memory analysis and detection in action
Chat with Your Cluster
Learn advanced Chat queries and tips
Understand Core Concepts
Deep dive into how RubixKube works
Common Questions
Why are my Insights empty?
Why are my Insights empty?
Answer: If everything is healthy, you won’t see insights! RubixKube only alerts on actual issues.To test: Deploy our tutorial scenarios to see detection in action.
How often does the dashboard refresh?
How often does the dashboard refresh?
Answer: Real-time via WebSocket connection. You’ll see updates within seconds of changes.Manual refresh: Click the “Refresh all data” button.
Can I customize the dashboard?
Can I customize the dashboard?
Answer: The Workspace feature (coming soon) will let you create custom dashboards.Beta: Use the Chat to query specific data you want to see.
What does '20 notifications' mean?
What does '20 notifications' mean?
Answer: Total events detected by RubixKube. Click the notification bell to see details.Includes: Incidents, insights, agent activity, system events.
Pro Tips
Use Keyboard Shortcuts
⌘K- Open search- Quick navigation to any page
Bookmark Important Views
- Dashboard for daily check-ins
- Insights for incident review
- Chat for quick queries
Check Agents Daily
Ensure all 3 agents show “Just now” for last activity
Explore Integrations
Connect Slack for notifications or Prometheus for enhanced metrics
Troubleshooting
Dashboard shows 'Initializing...' forever
Dashboard shows 'Initializing...' forever
Possible causes: - Observer agent not connected
- Network connectivity issue
- Browser cache problem
kubectl get pods -n rubixkube
2. Verify it’s running (STATUS = Running)
3. Clear browser cache and refresh
4. Try different browserAgents showing as offline
Agents showing as offline
Check:
- Navigate to Agents page
- Look for “Last active” timestamp
- If >5 minutes ago, agent may be unhealthy
No insights showing despite pod failures
No insights showing despite pod failures
RubixKube takes 1-2 minutes to detect and analyze issues.
If failures are immediate but no insights after 5 minutes:- Check observer agent is running
- Verify namespace is being watched (default: all namespaces)
- Check RubixKube dashboard for agent status
What’s Next?
You’ve completed the basics! Now it’s time to see RubixKube detect real issues:Continue to: Detecting Pod Failures
Learn by watching RubixKube detect and analyze common Kubernetes failures
Need Help?
Support
Email: connect@rubixkube.ai
Documentation
Browse our complete guides
Concepts
Understand how RubixKube works
Community
Join our Slack community