Testing RubixKube on a cloud cluster gives you a more realistic experience compared to local KIND clusters, including real cloud resources, load balancers, and persistent storage.
Supported Cloud Platforms
RubixKube works with all major cloud Kubernetes platforms:AWS EKS
Amazon Elastic Kubernetes Service
Google GKE
Google Kubernetes Engine
Azure AKS
Azure Kubernetes Service
Other Platforms: RubixKube also works with DigitalOcean Kubernetes, Linode LKE, and other managed Kubernetes services.
Prerequisites
Before installing RubixKube on your cloud cluster, ensure you have:Required Tools
kubectl - Kubernetes CLI
kubectl - Kubernetes CLI
Installation:Verify:
Cloud Provider CLI (Choose One)
Cloud Provider CLI (Choose One)
Install the CLI for your cloud provider:AWS CLI (for EKS):Google Cloud CLI (for GKE):Azure CLI (for AKS):
RubixKube Account
RubixKube Account
You need a RubixKube account to get your installation command with API key.If you don’t have one:
- Visit console.rubixkube.ai
- Sign up for free
- Verify your email
- Log in to access your dashboard
Cloud Requirements
- AWS EKS
- Google GKE
- Azure AKS
Minimum Cluster Specs:
- Kubernetes version: 1.24+
- Node type: t3.medium or larger (2 vCPU, 4GB RAM minimum)
- Number of nodes: 1+ (2-3 recommended for testing)
- IAM permissions for kubectl access
- Node type: t3.large (2 vCPU, 8GB RAM)
- Number of nodes: 2-3
- Enable CloudWatch integration
Step 1: Create or Connect to Your Cluster
- AWS EKS
- Google GKE
- Azure AKS
Create an EKS Cluster (if you don’t have one)
Option 1: Using eksctl (Recommended for Testing)- Go to AWS EKS Console
- Click “Create cluster”
- Name:
rubixkube-test - Kubernetes version: 1.24 or higher
- Follow the wizard to create node groups
- Wait for cluster to be active
Connect to Your EKS Cluster
Verify Connection
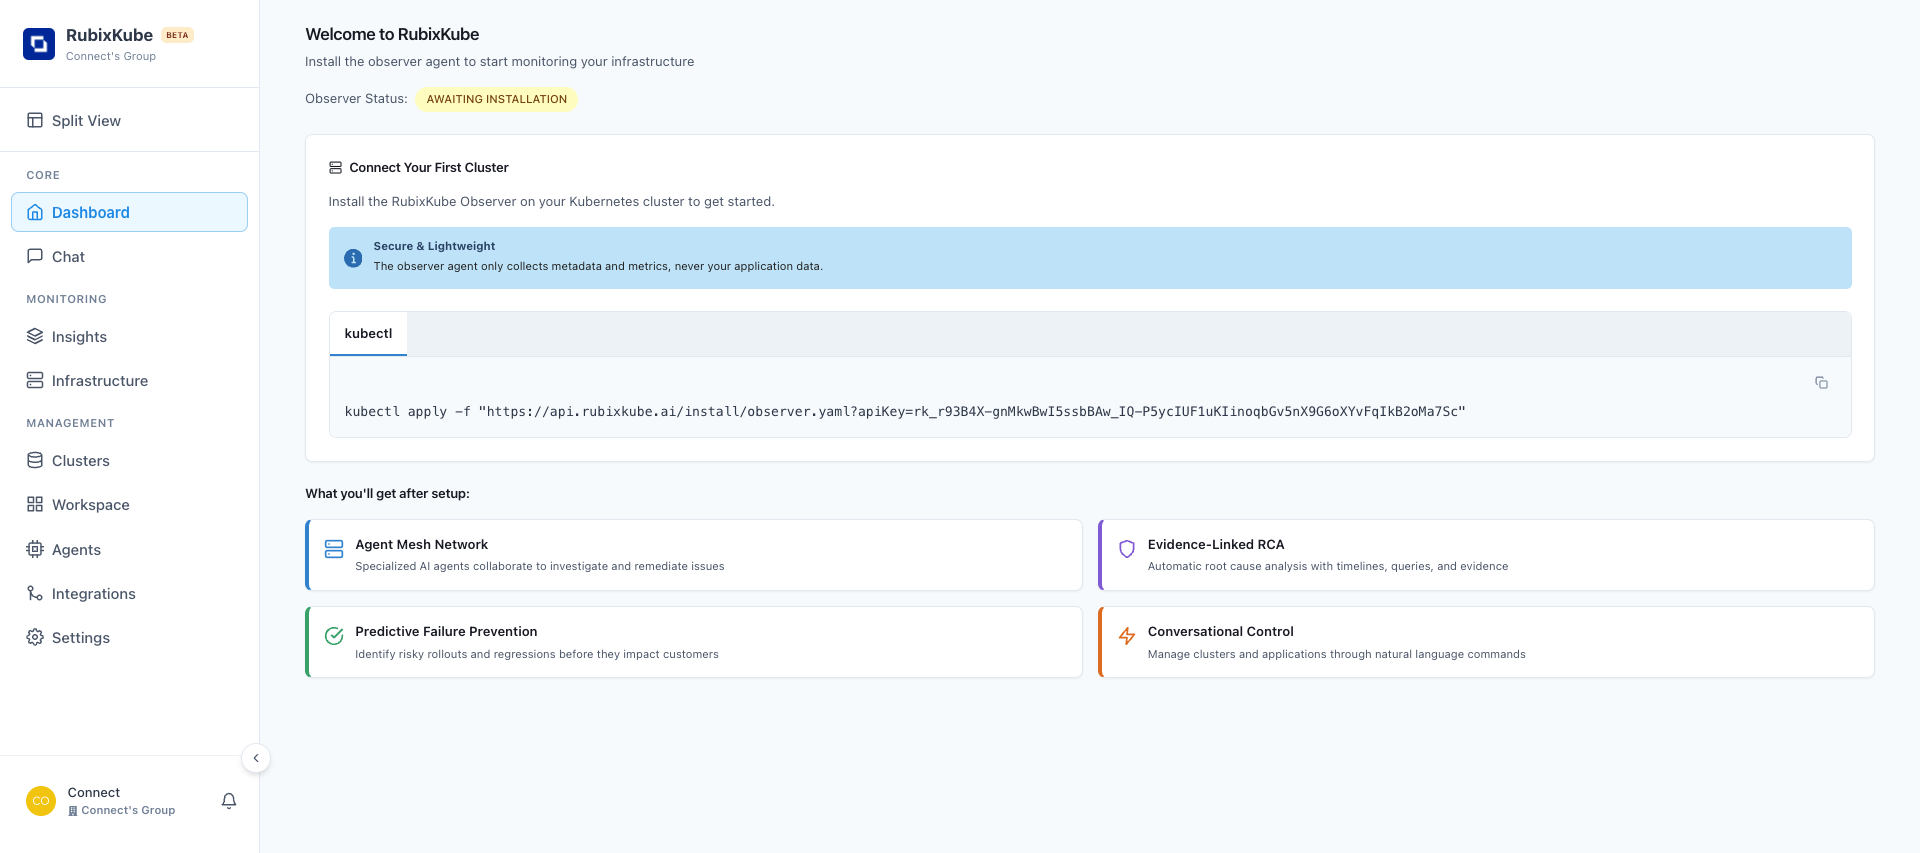
Step 2: Get Your RubixKube Installation Command
Now that your cluster is ready, let’s install RubixKube!Access Your Dashboard
- Log in to console.rubixkube.ai
- After login, you’ll see the “Connect Your First Cluster” screen
- Copy the installation command - it’s pre-configured with your unique API key
Step 3: Install RubixKube Observer
Run the Installation Command
Paste your command from the dashboard into your terminal: What does the observer do?
What does the observer do?
The RubixKube observer agent:
- Monitors your cluster resources (pods, deployments, services, nodes)
- Collects metrics and events (NOT your application data)
- Detects anomalies and potential issues
- Communicates with RubixKube AI agents for analysis
- Reports cluster health to your dashboard
Step 4: Verify Installation
Let’s confirm RubixKube is running correctly in your cluster.Check Namespace Created
Check Pod Status
What indicates successful installation?
What indicates successful installation?
Look for these indicators:
If you see
| Column | Expected Value | Meaning |
|---|---|---|
| READY | 1/1 | Container is ready |
| STATUS | Running | Pod is active |
| RESTARTS | 0 or low number | Stable, no crashes |
| AGE | Increasing | Pod staying alive |
1/1 Running, you’re good! Troubleshooting: ImagePullBackOff
Troubleshooting: ImagePullBackOff
Problem: Pod can’t download the RubixKube image.Common causes:If issue persists after 5 minutes, contact support@rubixkube.ai
- Cluster lacks internet access
- Container registry authentication issue
- Network policies blocking outbound traffic
- Check pod details:
- Verify internet connectivity:
- Check events:
Troubleshooting: CrashLoopBackOff
Troubleshooting: CrashLoopBackOff
Problem: Pod starts but immediately crashes.Most common cause: Invalid or missing API keySolution:
- Check logs to see error:
- Look for authentication errors:
- “Invalid API key”
- “Unauthorized”
- “Failed to connect to RubixKube API”
- Reinstall with correct API key:
Troubleshooting: Pending Status
Troubleshooting: Pending Status
Problem: Pod stuck in “Pending” state.Common causes:
- Not enough cluster resources
- No nodes available
- Storage provisioning issues
- Check node resources:
- Check pod events:
- Scale your node pool if resources are exhausted
Check Observer Logs
View what RubixKube is doing:Verify in RubixKube Dashboard
- Go to console.rubixkube.ai
- Navigate to Dashboard ** or ** Clusters page
- Your cluster should appear with:
- Green status indicator (Connected)
- Metrics starting to populate
- Observer Status: “Active”
Sync Delay: It may take 1-2 minutes for your cluster to appear and sync initial data to the dashboard.
Step 5: Deploy Test Workloads (Optional)
Want to see RubixKube in action? Deploy some test applications!Deploy Sample Apps
Watch RubixKube Detect Issues
- Go to console.rubixkube.ai
- Navigate to Infrastructure ** or ** Insights
- You’ll see:
- nginx and redis running healthy
- broken-app showing
ImagePullBackOfferror - RubixKube AI analyzing the broken pod
Cloud-Specific Configurations
AWS EKS: IAM Permissions
For full RubixKube functionality on EKS:Google GKE: Workload Identity
For enhanced security on GKE:Azure AKS: Managed Identity
AKS uses managed identities by default. No additional configuration needed for RubixKube observer.Managing Your Installation
View All RubixKube Resources
Update RubixKube Observer
When a new version is available:Restart RubixKube Observer
If you need to restart the observer:View Observer Configuration
Check Resource Usage
- CPU Request: 100m (0.1 cores)
- Memory Request: 128Mi
- Memory Limit: 512Mi
- rubixkube-observer — Event collection and monitoring
- kubernetes-mcp-server — Kubernetes API integration
- Memory: ~255Mi combined (observer ~146Mi, MCP server ~109Mi)
- CPU: Under 10 millicores combined (typically ~7m)
Uninstalling RubixKube
Remove RubixKube from Your Cluster
If you want to uninstall RubixKube:- Observer deployment
- Service accounts
- RBAC roles and bindings
- Configuration and secrets
Delete Your Test Cluster
When you’re done testing:- AWS EKS
- Google GKE
- Azure AKS
Common Issues & Solutions
kubectl: connection refused
kubectl: connection refused
Error:
The connection to the server localhost:8080 was refusedCause: kubectl is not configured to connect to your clusterSolution:- Run the “update kubeconfig” command for your cloud provider (see Step 1)
- Verify with:
kubectl config current-context
Unauthorized / Forbidden errors
Unauthorized / Forbidden errors
Observer pod keeps restarting
Observer pod keeps restarting
Problem: RESTARTS column shows increasing numbersDiagnosis:Common causes:
- Network connectivity issues
- API key expired or invalid
- Memory limits too low
Cluster not appearing in dashboard
Cluster not appearing in dashboard
Problem: Cluster successfully installed but not showing in RubixKube consoleChecklist:
- Wait 2-3 minutes - Initial sync takes time
- Check pod is Running:
- Check observer logs for connection:
- Verify API key is correct:
- Check outbound connectivity:
Network policy blocking RubixKube
Network policy blocking RubixKube
Problem: Cluster has strict network policiesSolution: Allow egress to RubixKube API:Apply with:
Beta Testing Best Practices
Since RubixKube is in Beta, follow these practices:Use Test Environments Only
- Install on dev/staging clusters
- Never on production (yet)
- Create isolated test namespaces
- Use non-critical workloads
Monitor Resource Usage
- Check observer CPU/memory usage
- Set resource limits if needed
- Watch for cluster impact
- Report any performance issues
Provide Feedback
- Report bugs to support@rubixkube.ai
- Suggest features you need
- Share your use cases
- Help us improve!
Stay Updated
- Watch for release updates
- Subscribe to changelog
- Test new features
- Upgrade regularly
Your Feedback Matters! As a beta tester, your input directly shapes RubixKube’s development. We appreciate every bug report and suggestion.
Resource Limits & Cost Optimization
Set Resource Limits (Recommended)
To control RubixKube observer resource usage:Cost Management Tips
AWS Cost Optimization
AWS Cost Optimization
- Use Spot Instances for node groups (not for control plane)
- Set up Cluster Autoscaler to scale down when idle
- Use Fargate for serverless nodes (optional)
- Enable Cost Explorer to track spending
- Delete cluster when not in use:
eksctl delete cluster
GKE Cost Optimization
GKE Cost Optimization
- Enable Autopilot mode for cost-efficient scaling
- Use Preemptible VMs for testing (cheaper)
- Set node auto-provisioning for dynamic sizing
- Enable GKE usage metering to track costs
- Delete cluster when not testing:
gcloud container clusters delete
Azure Cost Optimization
Azure Cost Optimization
- Use Spot VMs for node pools (70-90% cheaper)
- Enable cluster autoscaler for automatic scaling
- Set start/stop schedules for dev clusters
- Use Azure Cost Management to monitor spending
- Delete cluster when done:
az aks delete
Next Steps
Explore the Dashboard
Take your first tour of the RubixKube console
Break Something on Purpose
Learn by watching RubixKube detect and analyze issues
Chat with Your Cluster
Use natural language to query your infrastructure
Understand Core Concepts
Learn about Site Reliability Intelligence
Cluster Comparison
| Feature | Local KIND | Cloud Cluster |
|---|---|---|
| Cost | Free | $50-100+/month |
| Setup Time | 5-10 min | 10-20 min |
| Realistic Testing | Limited | High |
| Internet Required | Only for sync | Always |
| Load Balancers | Simulated | Real cloud LBs |
| Persistent Storage | Limited | Full PVC support |
| Multi-node | Simulated | Real distributed nodes |
| Auto-scaling | No | Yes |
| Production-like | 40% | 95% |
Security Considerations
What data does RubixKube collect?
What data does RubixKube collect?
RubixKube observer collects:Metadata: Pod names, namespaces, labels
Metrics: CPU, memory, network usage
Events: Kubernetes events and state changes
Status: Health checks and readinessNEVER collects: Application logs, secrets, environment variables, or business dataAll data is encrypted in transit (TLS) and at rest.
What permissions does RubixKube need?
What permissions does RubixKube need?
RubixKube observer requires read-only cluster access:
- View pods, deployments, services (read-only)
- Read events and metrics (read-only)
- No write/delete permissions on your resources
Is my API key secure?
Is my API key secure?
Your API key is stored as a Kubernetes secret:Best practices:
- Never commit API keys to git
- Rotate keys every 90 days (from dashboard)
- Revoke keys immediately if compromised
- Use different keys for different environments
Need Help?
Support
Email: support@rubixkube.ai
For installation issues
For installation issues
Bug Reports
Email: bugs@rubixkube.ai
Found a bug? Let us know!
Found a bug? Let us know!
Documentation
Visit our troubleshooting guide
Community
Join our Slack for real-time help
What’s Next?
After successfully installing RubixKube on your cloud cluster:- Explore Features - Navigate through Dashboard, Insights, and Infrastructure views
- Run Tutorials - Follow our hands-on guides to see RubixKube in action
- Provide Feedback - Tell us what works and what doesn’t
- Plan for Production - Start thinking about your production deployment strategy
Start with First Steps Tutorial
Learn the RubixKube interface and run your first queries