Detecting Memory Issues (OOMKilled)
Out of Memory (OOM) errors are critical failures that cause pods to be killed by Kubernetes. Let’s see how RubixKube detects memory issues, analyzes them, and suggests solutions.What you’ll learn:
- Creating a memory-constrained pod
- How RubixKube detects OOMKilled events
- Reading memory usage analysis
- Understanding resource limit recommendations
- Fixing memory issues
The Scenario: Memory Overflow
We’ll create a pod that intentionally exceeds its memory limit to trigger an OOMKilled event.Create the Memory Hog Pod
- Requests 50Mi of memory
- Tries to allocate 100Mi (double the limit)
- Kubernetes kills it when memory exceeds limit
Watch the OOM Cycle
The pod will go through a cycle:- ContainerCreating - Kubernetes starts the container
- OOMKilled - Container exceeds memory, Kubernetes kills it
- CrashLoopBackOff - Kubernetes waits before restarting
- Repeat - Cycle continues forever
This is a real production problem! Pods stuck in this cycle waste resources and cause service degradation.
RubixKube Detection (Within 2 Minutes)
Open the RubixKube Dashboard. What you’ll see:
Detection Indicators
Activity Feed shows TWO related incidents:-
“Out of memory (OOMKilled) detected on Pod/memory-hog-demo”
- Severity: HIGH
- Status: Active
- Detected: Immediately after first OOM
-
“Container experiencing repeated crashes in memory-hog-demo”
- Severity: Medium
- Status: Active
- Restart count: Tracked automatically
Viewing Detailed Analysis
Navigate to Insights to see the full analysis:Incident Details
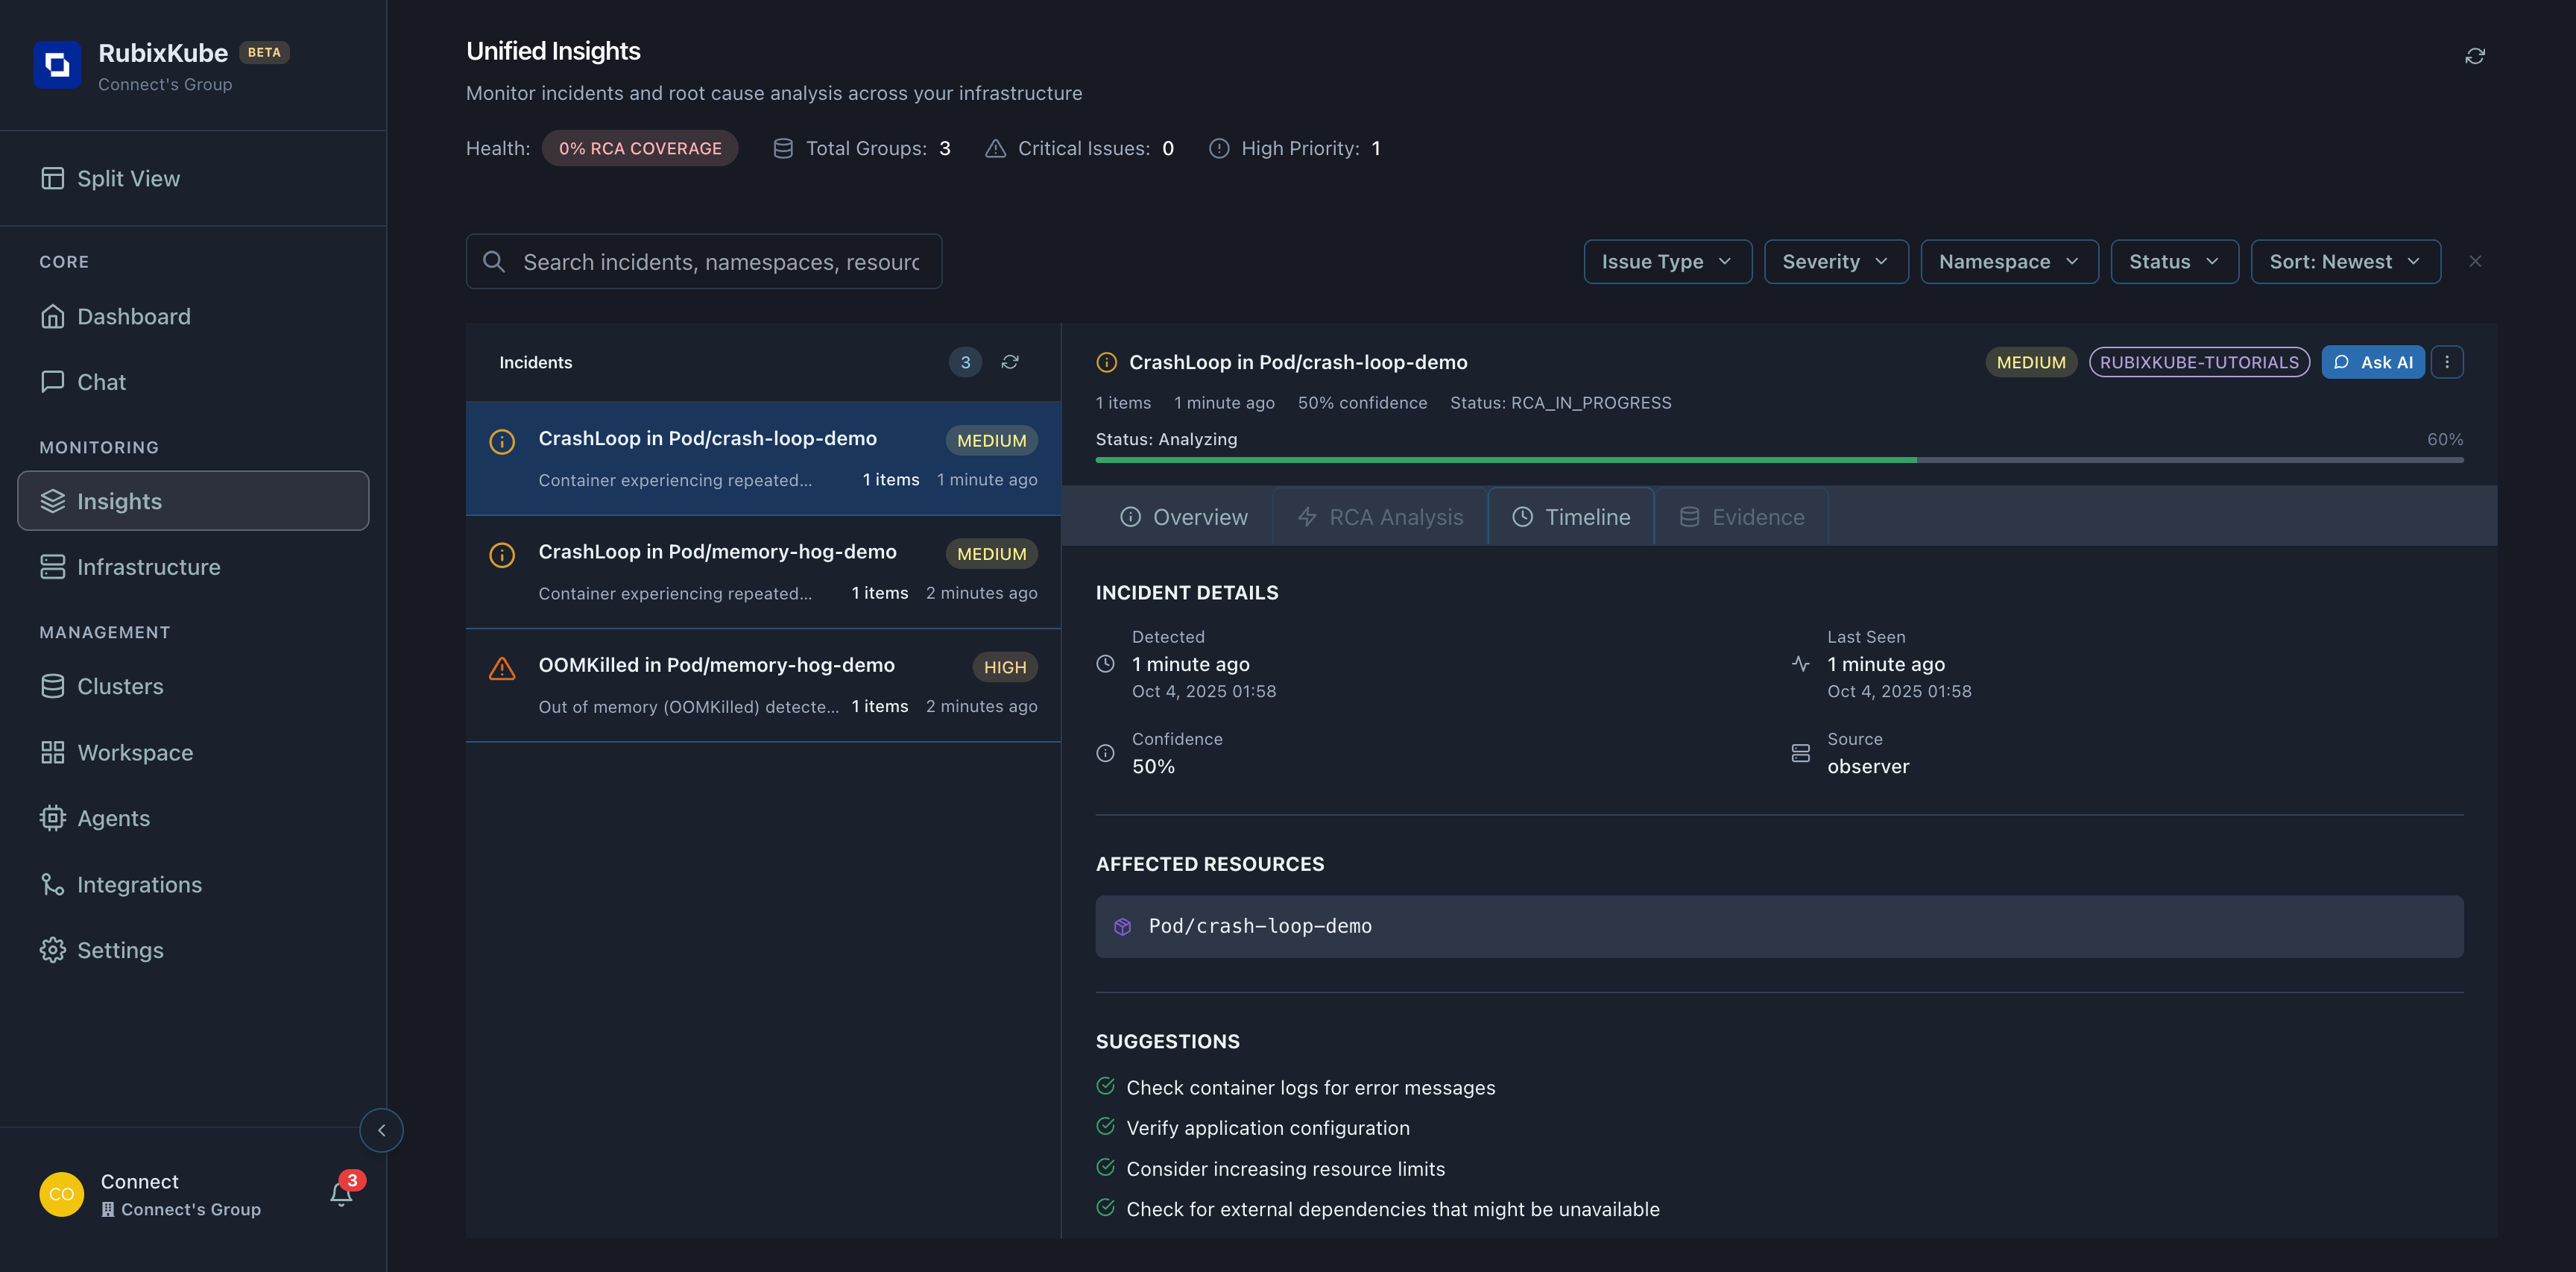
Root Cause
OOMKilled - Container exceeded memory limits
Affected Resource
Pod/memory-hog-demo in namespace rubixkube-tutorials
Restart Count
3 restarts (and counting) - Problem persists
Confidence
90%+ - RubixKube is highly confident about the diagnosis
Memory Analysis
RubixKube’s analysis includes:AI-Generated Suggestions
Based on the analysis, RubixKube suggests:Increase Memory Limits
Recommended action: Double the memory limitWhy: Application needs ~100Mi based on observed behavior
Check for Memory Leaks
If restarts continue after increasing limits:
- Monitor memory usage over time
- Look for gradual increase (leak pattern)
- Check application code for issues
Fixing the Memory Issue
Method 1: Delete and Recreate (Easiest)
Method 2: Update Deployment (Production Approach)
If this were a Deployment (not a standalone Pod):Verify the Fix
Check the new pod:RubixKube Confirms Resolution
Back in the Dashboard: Within 1-2 minutes:- Active Insights decreases (OOMKilled incident marked resolved)
- Activity Feed shows “Incident resolved” event
- System Health improves
- Memory Engine records: “OOMKilled fixed by increasing memory 50Mi → 150Mi”
What the Memory Engine Learned
RubixKube now knows: Pattern Recognized:- RubixKube will recall this pattern
- Suggest the proven fix immediately
- Calculate appropriate memory based on actual usage
- Recommend buffer (typically 30-50% over observed peak)
Memory Best Practices
Set Requests = Limits for Critical Pods
Set Requests = Limits for Critical Pods
Guaranteed QoS:Benefit: Kubernetes won’t evict these pods under memory pressure
Use Requests < Limits for Burstable Workloads
Use Requests < Limits for Burstable Workloads
Burstable QoS:Benefit: Efficient resource usage, can handle spikes
Monitor Actual Usage Over Time
Monitor Actual Usage Over Time
Right-sizing:RubixKube helps: Memory Engine tracks usage trends over weeks/months
Enable Horizontal Pod Autoscaling (HPA)
Enable Horizontal Pod Autoscaling (HPA)
Auto-scaling:Benefit: Kubernetes scales replicas before OOM occurs
Cleanup
Remove the demo pods:- All demo pods
- Associated events
- Namespace resources
- Incident history in Memory Engine
- Learned patterns
- RCA reports for future reference
Key Takeaways
Fast Detection
RubixKube detected OOMKilled within 2 minutes - no configuration needed
Intelligent Analysis
Correlated OOM event with crash loop - showed ROOT CAUSE
Actionable Suggestions
Specific recommendations: increase memory, check for leaks, verify quotas
Learning System
Memory Engine stored the pattern for faster resolution next time