Prompt recipes for the work SREs do most in Kepler: triage an alert, investigate a pod, write an RCA, review a deploy, read a dashboard, bring terminal output into the chat, write a runbook, hand off on-call.
This page covers the situations you will use Kepler for most, each with a starting prompt and what to expect back. Every example works in Observe, the read-only default. Where a step changes something, it says so.
Suppose a page just came in for the payments service and you need to know in two minutes whether it is real and how bad it is.
/triage payments
Payments latency alert fired at 14:02. Is it real, what is affected, and is it getting worse?
Kepler checks the service’s pods, recent events and logs, reads whatever dashboards it has access to, and answers with severity, blast radius and a first hypothesis. Each command it ran is a card in the chat, so you can see the evidence rather than take its word.
Say what “normal” looks like if Kepler has not seen this service before. “Normally under 200 ms p99” turns a vague answer into a precise one. Kepler remembers it for next time.
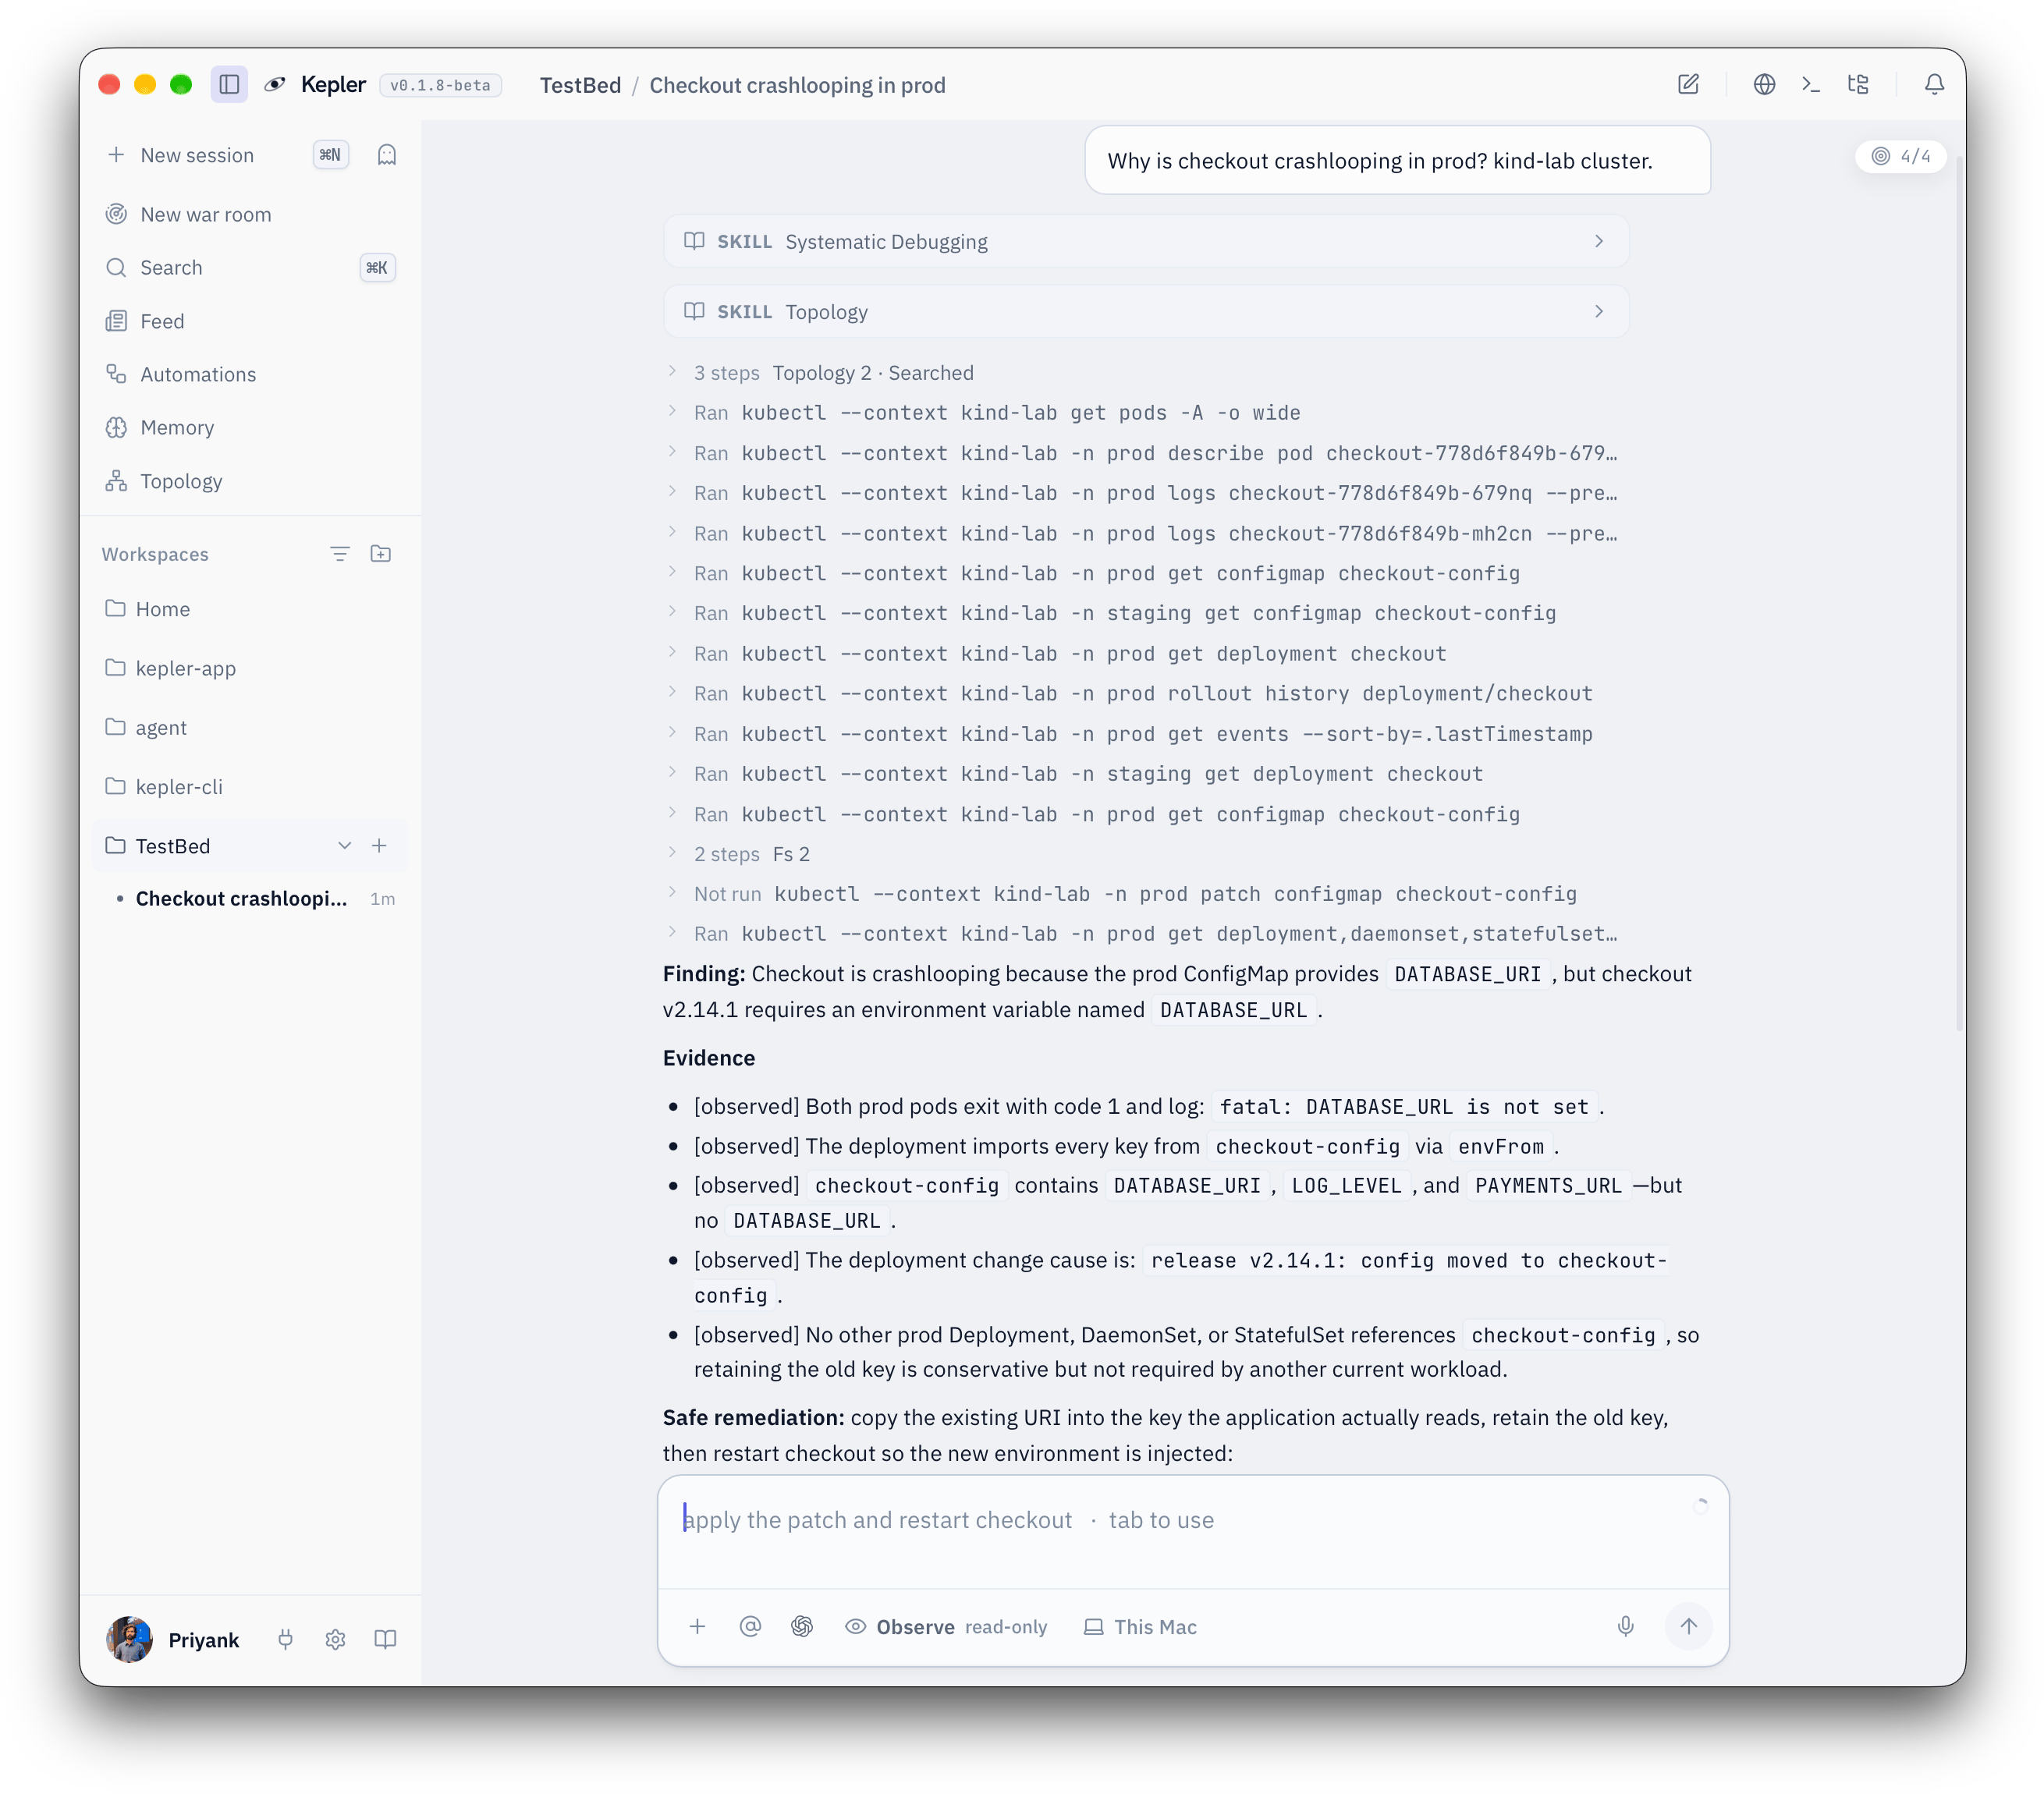
Suppose checkout pods are crashlooping and the logs are not obvious.
/investigate checkout pods crashlooping in prod
Why is checkout-7d9f crashlooping? Check the previous container's logs, not the current one.
Something in the cart namespace is returning 502s. Find which pod and why.
Kepler works the problem the way you would: describe the pod, read the termination reason, pull the previous logs, compare the mounted config against the last change. On long investigations a checklist appears above the composer and ticks itself off as it goes. When it reaches a real fork it stops and asks you, in a card over the composer, rather than guessing.
Suppose the incident is over and you owe a postmortem.
/rca the checkout outage this morning
Write the RCA for the 502s we just fixed. Timeline, cause, evidence, what we changed, what would have caught it earlier.
Kepler assembles the write-up from the investigation in the thread, the commands it ran and what it already knows about the service. Ask for it as an artifact and it lands in the Artifacts tab of the Memory panel under a stable name, versioned each time you ask for a revision.
Suppose errors started right after a release and you want to know whether the deploy is to blame before you touch anything.
Errors started at 09:40. Was it the 09:35 deploy of api? Show me what changed.
Compare the running api deployment against the previous revision.
Both of those are read-only. When you are ready to act, switch to Assist with Shift+Tab and ask:
/rollback api v2.14.1
Kepler works out the rollback and proposes it step by step in the approval dock over the composer. Nothing runs until you approve it. Any step on the always-blocked list, such as a rollout undo, Kepler hands to you to run yourself in the terminal panel, with the checks to do before and after.
Deleting, scaling, draining and restarting rollouts stay blocked in every posture. Kepler will tell you when it hits that floor and give you the command to run yourself. See Permissions.
Suppose the answer is on a Grafana board and you would rather not describe the graph in words.
Open https://grafana.internal/d/checkout and tell me what p99 latency did between 09:30 and 10:00.
Look at the error-rate panel on the dashboard I have open. Did the spike line up with the deploy?
Paste a dashboard URL and the browser panel opens beside the chat. Log in once and Kepler can read that dashboard from then on. It reads the page, takes screenshots when it needs to, and quotes what it saw.
Suppose you already ran the command yourself and want Kepler to interpret the output.Open the terminal with Cmd+J (Ctrl+J on Windows and Linux). Everything you and Kepler run appears here. Click any command in the scrollback and Kepler receives the command together with its output. Then ask:
That describe output I just sent you. Why is the readiness probe failing?
You can also type ! at the start of the composer to run a shell command yourself without leaving the chat.
Suppose you need the procedure for something you do twice a year.
/runbook rotate the Redis password in prod
Is there a runbook for draining a node in the payments cluster? If not, write one from what we did today.
Kepler searches its memory for a matching runbook and summarizes it. If there is none, it drafts one from the current thread and saves it, so the next person who asks gets a real answer.
Suppose your on-call shift ends in ten minutes and two things are still open.
/handoff
Write the handoff for the next on-call. Include the open checkout issue, what we ruled out, and what to watch.
Kepler writes the handoff from the sessions of the day: what happened, what is still open, what to watch, and where the evidence is. Paste it into your team channel, or keep it in the thread for the next person to open.
Suppose the fix is several steps and you want to read the whole thing before the first command.
/plan move the cart service to the new node pool without downtime
Kepler writes the change out as a plan you can read and edit. Nothing runs while you review it. When you approve, the plan sits above the composer and ticks off each step as it lands. /plan works in every posture, including Observe.