> ## Documentation Index
> Fetch the complete documentation index at: https://docs.rubixkube.ai/llms.txt
> Use this file to discover all available pages before exploring further.
# Magic Insights
> Incident detection, root cause analysis, and evidence-based troubleshooting in the RubixKube console.
# Using Insights & RCA: Complete Guide
The **Insights** page is where RubixKube's intelligence shines - showing you not just WHAT failed, but WHY it failed, with complete root cause analysis, evidence, and remediation suggestions.
Based on real data: This guide uses actual screenshots from a live RubixKube console monitoring 4 incident groups with 75% RCA coverage, including CrashLoop, OOMKilled, and PodPending issues.
***
## Insights Overview
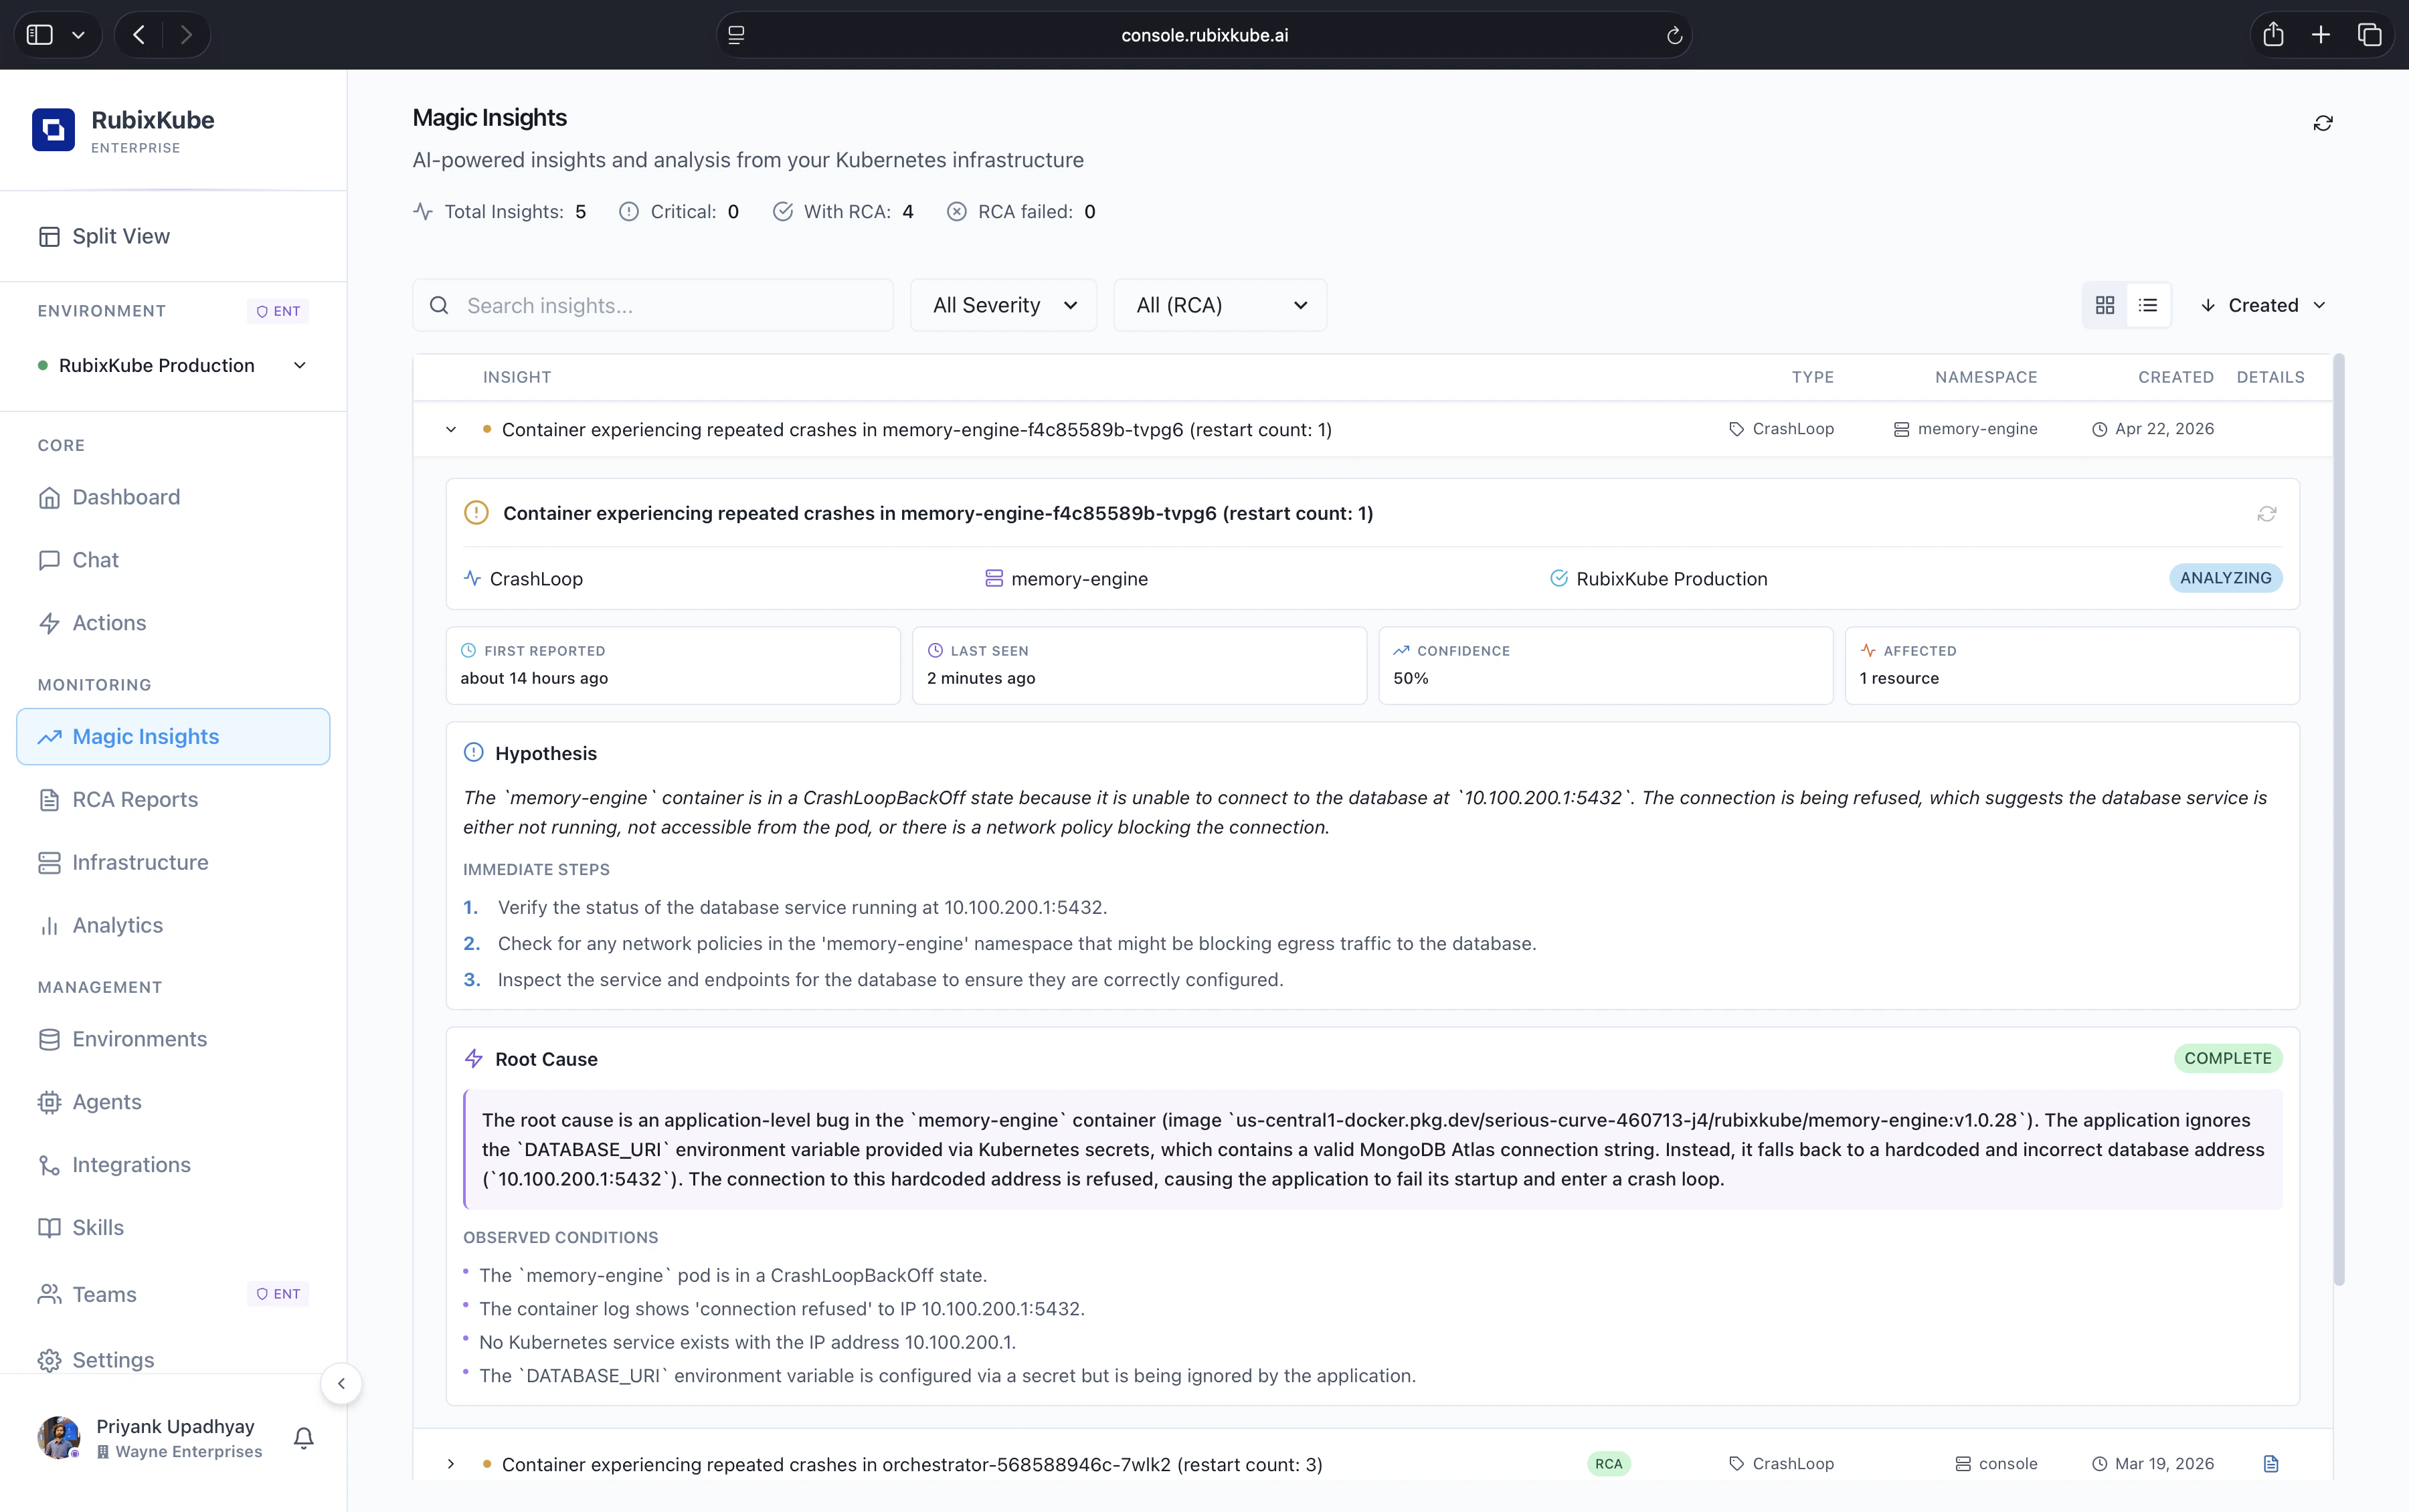 Magic Insights. The list shows every anomaly RubixKube has opened, and each one expands into a full hypothesis, immediate steps, and, when ready, a completed root cause.
**The header shows:**
* **Total Insights**: every open anomaly in the selected environment.
* **Critical**: insights flagged as blocking.
* **With RCA**: insights that already have a completed root-cause report.
* **RCA failed**: insights where evidence did not converge on a single cause.
* **Refresh data** button for a manual update.
***
## Understanding Health Metrics
### Health: 75% RCA Coverage
**What it means:** - 75% of detected incidents have completed RCA analysis
* Higher percentage = better analysis coverage
* Target: 90%+ for optimal observability
**Why it matters:** - Shows how effectively RubixKube is analyzing your incidents
* Low coverage may indicate agent issues or complex incidents
* Tracks the intelligence level of your monitoring
***
### Total Groups: 4
**What it means:** - 4 incident groups currently tracked
* Groups cluster related incidents together
* Each group may contain multiple occurrences
**From our dashboard:** 1. CrashLoop in Pod/crash-loop-demo (2 items)
2\. OOMKilled in Pod/memory-hog-demo (2 items)
3\. CrashLoop in Pod/memory-hog-demo (2 items)
4\. PodPending in Pod/broken-image-demo (1 item)
***
### Critical Issues: 0
**What it means:** - No critical-severity incidents active
* Critical = system-wide failures, data loss risk
* This is your most important metric
**When you see this:** - 0 = Excellent, no urgent action needed
* 1+ = Immediate response required
***
### High Priority: 1
**What it means:** - 1 high-severity incident requiring attention
* High = significant impact, needs prompt resolution
* Less urgent than critical, more than medium
**From our dashboard:** - OOMKilled in Pod/memory-hog-demo (HIGH severity)
***
## Search and Filtering
Magic Insights. The list shows every anomaly RubixKube has opened, and each one expands into a full hypothesis, immediate steps, and, when ready, a completed root cause.
**The header shows:**
* **Total Insights**: every open anomaly in the selected environment.
* **Critical**: insights flagged as blocking.
* **With RCA**: insights that already have a completed root-cause report.
* **RCA failed**: insights where evidence did not converge on a single cause.
* **Refresh data** button for a manual update.
***
## Understanding Health Metrics
### Health: 75% RCA Coverage
**What it means:** - 75% of detected incidents have completed RCA analysis
* Higher percentage = better analysis coverage
* Target: 90%+ for optimal observability
**Why it matters:** - Shows how effectively RubixKube is analyzing your incidents
* Low coverage may indicate agent issues or complex incidents
* Tracks the intelligence level of your monitoring
***
### Total Groups: 4
**What it means:** - 4 incident groups currently tracked
* Groups cluster related incidents together
* Each group may contain multiple occurrences
**From our dashboard:** 1. CrashLoop in Pod/crash-loop-demo (2 items)
2\. OOMKilled in Pod/memory-hog-demo (2 items)
3\. CrashLoop in Pod/memory-hog-demo (2 items)
4\. PodPending in Pod/broken-image-demo (1 item)
***
### Critical Issues: 0
**What it means:** - No critical-severity incidents active
* Critical = system-wide failures, data loss risk
* This is your most important metric
**When you see this:** - 0 = Excellent, no urgent action needed
* 1+ = Immediate response required
***
### High Priority: 1
**What it means:** - 1 high-severity incident requiring attention
* High = significant impact, needs prompt resolution
* Less urgent than critical, more than medium
**From our dashboard:** - OOMKilled in Pod/memory-hog-demo (HIGH severity)
***
## Search and Filtering
 ### Search Bar
**Placeholder**: "Search incidents, namespaces, resources..."
**What you can search:** - Pod names (e.g., "crash-loop-demo")
* Namespaces (e.g., "rubixkube-tutorials")
* Incident types (e.g., "OOMKilled")
* Resource types (e.g., "Pod/")
**Search is instant** - results filter as you type.
***
### Filter Buttons
### Available filters:
| Filter | Options | Use Case |
| -------------- | -------------------------------------- | ------------------------------ |
| **Issue Type** | CrashLoop, OOMKilled, PodPending, etc. | Find specific failure patterns |
| **Severity** | critical, high, medium, low | Prioritize by impact |
| **Namespace** | All namespaces in cluster | Isolate env-specific issues |
| **Status** | Active, Resolved, Investigating | Track incident lifecycle |
| **Sort** | Newest, Oldest, Severity | Order results |
***
### Severity Filter
### Search Bar
**Placeholder**: "Search incidents, namespaces, resources..."
**What you can search:** - Pod names (e.g., "crash-loop-demo")
* Namespaces (e.g., "rubixkube-tutorials")
* Incident types (e.g., "OOMKilled")
* Resource types (e.g., "Pod/")
**Search is instant** - results filter as you type.
***
### Filter Buttons
### Available filters:
| Filter | Options | Use Case |
| -------------- | -------------------------------------- | ------------------------------ |
| **Issue Type** | CrashLoop, OOMKilled, PodPending, etc. | Find specific failure patterns |
| **Severity** | critical, high, medium, low | Prioritize by impact |
| **Namespace** | All namespaces in cluster | Isolate env-specific issues |
| **Status** | Active, Resolved, Investigating | Track incident lifecycle |
| **Sort** | Newest, Oldest, Severity | Order results |
***
### Severity Filter
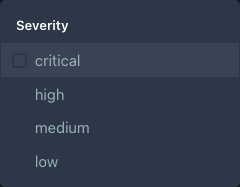 **Click "Severity" to see options:** - \*\* Click "Severity" to see options:\*\* - System-wide failures, immediate action
* **high** - Significant impact, prompt resolution needed
* **medium** - Moderate impact, address within hours
* **low** - Minor issues, informational
**Multiple selection** - Check multiple boxes to filter by several severities at once.
***
## Incident List
**Click "Severity" to see options:** - \*\* Click "Severity" to see options:\*\* - System-wide failures, immediate action
* **high** - Significant impact, prompt resolution needed
* **medium** - Moderate impact, address within hours
* **low** - Minor issues, informational
**Multiple selection** - Check multiple boxes to filter by several severities at once.
***
## Incident List
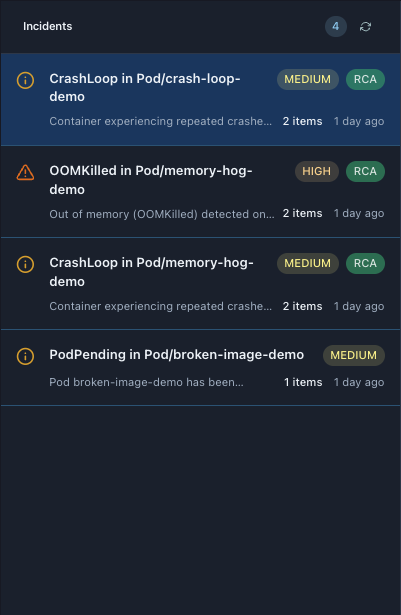 ### Incident Cards
### From our real dashboard - 4 incidents:
#### 1. CrashLoop in Pod/crash-loop-demo
**Visual indicators:** - Orange warning icon (left)
* **MEDIUM** severity badge
* **RCA** badge (analysis complete)
* "2 items" - multiple occurrences
* "1 day ago" - last seen timestamp
**Description**: "Container experiencing repeated crashes in crash-loop-demo (restart count: 3)"
**Status**: Expanded (showing details in right panel)
***
#### 2. OOMKilled in Pod/memory-hog-demo
**Visual indicators:** - Red warning triangle (left) - indicates high severity
* **HIGH** severity badge (critical attention needed)
* **RCA** badge (analysis complete)
* "2 items" - multiple OOMKilled events
* "1 day ago" - last occurrence
**Description**: "Out of memory (OOMKilled) detected on a pod in Pod/memory-hog-demo"
**This is the high-priority incident** shown in header metrics.
***
#### 3. CrashLoop in Pod/memory-hog-demo
**Visual indicators:** - Orange warning icon
* **MEDIUM** severity badge
* **RCA** badge
* "2 items"
* "1 day ago"
**Description**: "Container experiencing repeated crashes in memory-hog-demo (restart count: 3)"
**Note**: Same pod as #2, different incident type (crash vs OOM).
***
#### 4. PodPending in Pod/broken-image-demo
**Visual indicators:** - Orange warning icon
* **MEDIUM** severity badge
* **No RCA badge** - analysis not complete or not available
* "1 items" - single occurrence
* "1 day ago"
**Description**: "Pod broken-image-demo has been pending for an extended period"
**Likely cause**: ImagePullBackOff error.
***
## Incident Detail View
### Incident Cards
### From our real dashboard - 4 incidents:
#### 1. CrashLoop in Pod/crash-loop-demo
**Visual indicators:** - Orange warning icon (left)
* **MEDIUM** severity badge
* **RCA** badge (analysis complete)
* "2 items" - multiple occurrences
* "1 day ago" - last seen timestamp
**Description**: "Container experiencing repeated crashes in crash-loop-demo (restart count: 3)"
**Status**: Expanded (showing details in right panel)
***
#### 2. OOMKilled in Pod/memory-hog-demo
**Visual indicators:** - Red warning triangle (left) - indicates high severity
* **HIGH** severity badge (critical attention needed)
* **RCA** badge (analysis complete)
* "2 items" - multiple OOMKilled events
* "1 day ago" - last occurrence
**Description**: "Out of memory (OOMKilled) detected on a pod in Pod/memory-hog-demo"
**This is the high-priority incident** shown in header metrics.
***
#### 3. CrashLoop in Pod/memory-hog-demo
**Visual indicators:** - Orange warning icon
* **MEDIUM** severity badge
* **RCA** badge
* "2 items"
* "1 day ago"
**Description**: "Container experiencing repeated crashes in memory-hog-demo (restart count: 3)"
**Note**: Same pod as #2, different incident type (crash vs OOM).
***
#### 4. PodPending in Pod/broken-image-demo
**Visual indicators:** - Orange warning icon
* **MEDIUM** severity badge
* **No RCA badge** - analysis not complete or not available
* "1 items" - single occurrence
* "1 day ago"
**Description**: "Pod broken-image-demo has been pending for an extended period"
**Likely cause**: ImagePullBackOff error.
***
## Incident Detail View
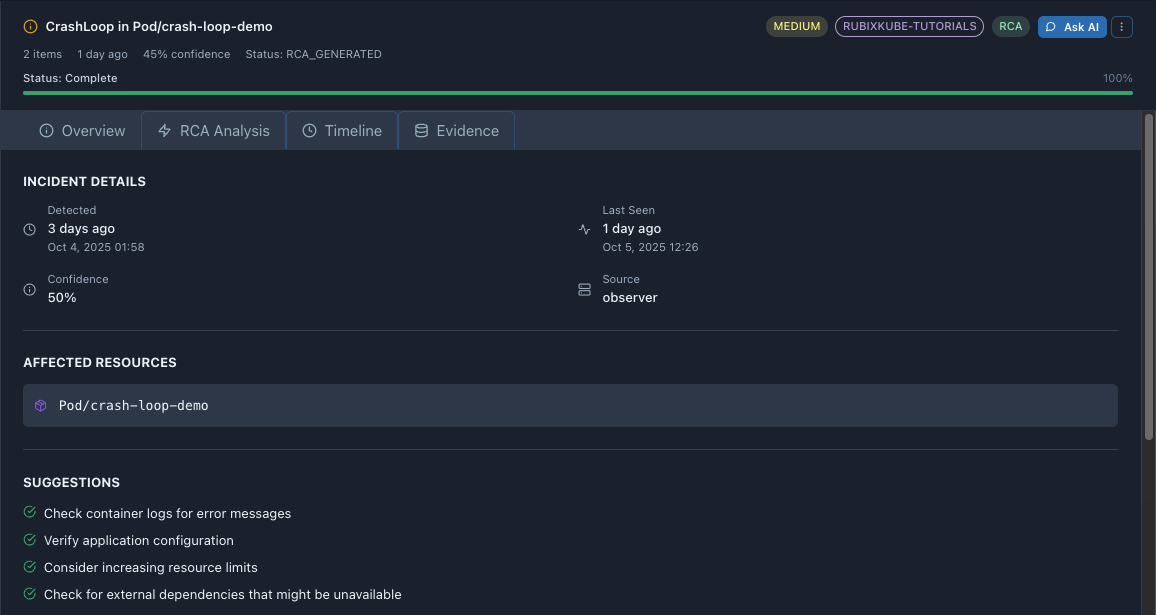 **Click any incident** to expand details in right panel.
### Header Section
### From our example - CrashLoop in Pod/crash-loop-demo:
**Title bar shows:** - Warning icon
* **Title**: CrashLoop in Pod/crash-loop-demo
* **Badges**:
* **MEDIUM** (severity)
* **RUBIXKUBE-TUTORIALS** (namespace)
* **RCA** (analysis complete)
* **Ask AI** button - Send to Chat for investigation
* **More actions** menu (three dots)
**Summary metrics:** - \*\* Summary metrics:\*\* - incident occurred twice
* \*\* 1 day ago\*\* - last occurrence
* \*\* 45% confidence\*\* - RCA confidence level
* **Status: RCA\_GENERATED** - analysis state
**Progress bar:** - \*\* Progress bar:\*\* - investigation finished
* \*\* 100%\*\* progress bar (green)
***
### Overview Tab
### Tab sections:
#### INCIDENT DETAILS
**Detected:** - \*\* Detected:\*\* - first occurrence
* Oct 4, 2025 01:58 - exact timestamp
**Last Seen:** - \*\* Last Seen:\*\* - most recent occurrence
* Oct 5, 2025 12:26 - exact timestamp
**Confidence:** - \*\* Confidence:\*\* - RCA confidence level
* Moderate confidence, review evidence
**Source:** - \*\* Source:\*\* - detected by RubixKube Observer Agent
***
#### AFFECTED RESOURCES
**Pod/crash-loop-demo** - Purple cube icon indicates Kubernetes Pod
* Clickable to view in Infrastructure
***
#### SUGGESTIONS
**Quick remediation steps** before full RCA:
1. Check container logs for error messages
2. Verify application configuration
3. Consider increasing resource limits
4. Check for external dependencies that might be unavailable
**These are generic** - full RCA provides specific root cause.
***
#### SOURCE EVENTS
**Original detection event:** - \*\* Type\*\*: CrashLoop
* **Pod**: crash-loop-demo
* **Details**: "CrashLoopBackOff: container app in pod crash-loop-demo restarted 3 times"
* **Namespace**: rubixkube-tutorials
***
#### PROVIDE TO CHAT CONTEXT
**Button at bottom** - sends entire incident context to Chat interface for AI-powered investigation.
***
## RCA Analysis Tab
**Click any incident** to expand details in right panel.
### Header Section
### From our example - CrashLoop in Pod/crash-loop-demo:
**Title bar shows:** - Warning icon
* **Title**: CrashLoop in Pod/crash-loop-demo
* **Badges**:
* **MEDIUM** (severity)
* **RUBIXKUBE-TUTORIALS** (namespace)
* **RCA** (analysis complete)
* **Ask AI** button - Send to Chat for investigation
* **More actions** menu (three dots)
**Summary metrics:** - \*\* Summary metrics:\*\* - incident occurred twice
* \*\* 1 day ago\*\* - last occurrence
* \*\* 45% confidence\*\* - RCA confidence level
* **Status: RCA\_GENERATED** - analysis state
**Progress bar:** - \*\* Progress bar:\*\* - investigation finished
* \*\* 100%\*\* progress bar (green)
***
### Overview Tab
### Tab sections:
#### INCIDENT DETAILS
**Detected:** - \*\* Detected:\*\* - first occurrence
* Oct 4, 2025 01:58 - exact timestamp
**Last Seen:** - \*\* Last Seen:\*\* - most recent occurrence
* Oct 5, 2025 12:26 - exact timestamp
**Confidence:** - \*\* Confidence:\*\* - RCA confidence level
* Moderate confidence, review evidence
**Source:** - \*\* Source:\*\* - detected by RubixKube Observer Agent
***
#### AFFECTED RESOURCES
**Pod/crash-loop-demo** - Purple cube icon indicates Kubernetes Pod
* Clickable to view in Infrastructure
***
#### SUGGESTIONS
**Quick remediation steps** before full RCA:
1. Check container logs for error messages
2. Verify application configuration
3. Consider increasing resource limits
4. Check for external dependencies that might be unavailable
**These are generic** - full RCA provides specific root cause.
***
#### SOURCE EVENTS
**Original detection event:** - \*\* Type\*\*: CrashLoop
* **Pod**: crash-loop-demo
* **Details**: "CrashLoopBackOff: container app in pod crash-loop-demo restarted 3 times"
* **Namespace**: rubixkube-tutorials
***
#### PROVIDE TO CHAT CONTEXT
**Button at bottom** - sends entire incident context to Chat interface for AI-powered investigation.
***
## RCA Analysis Tab
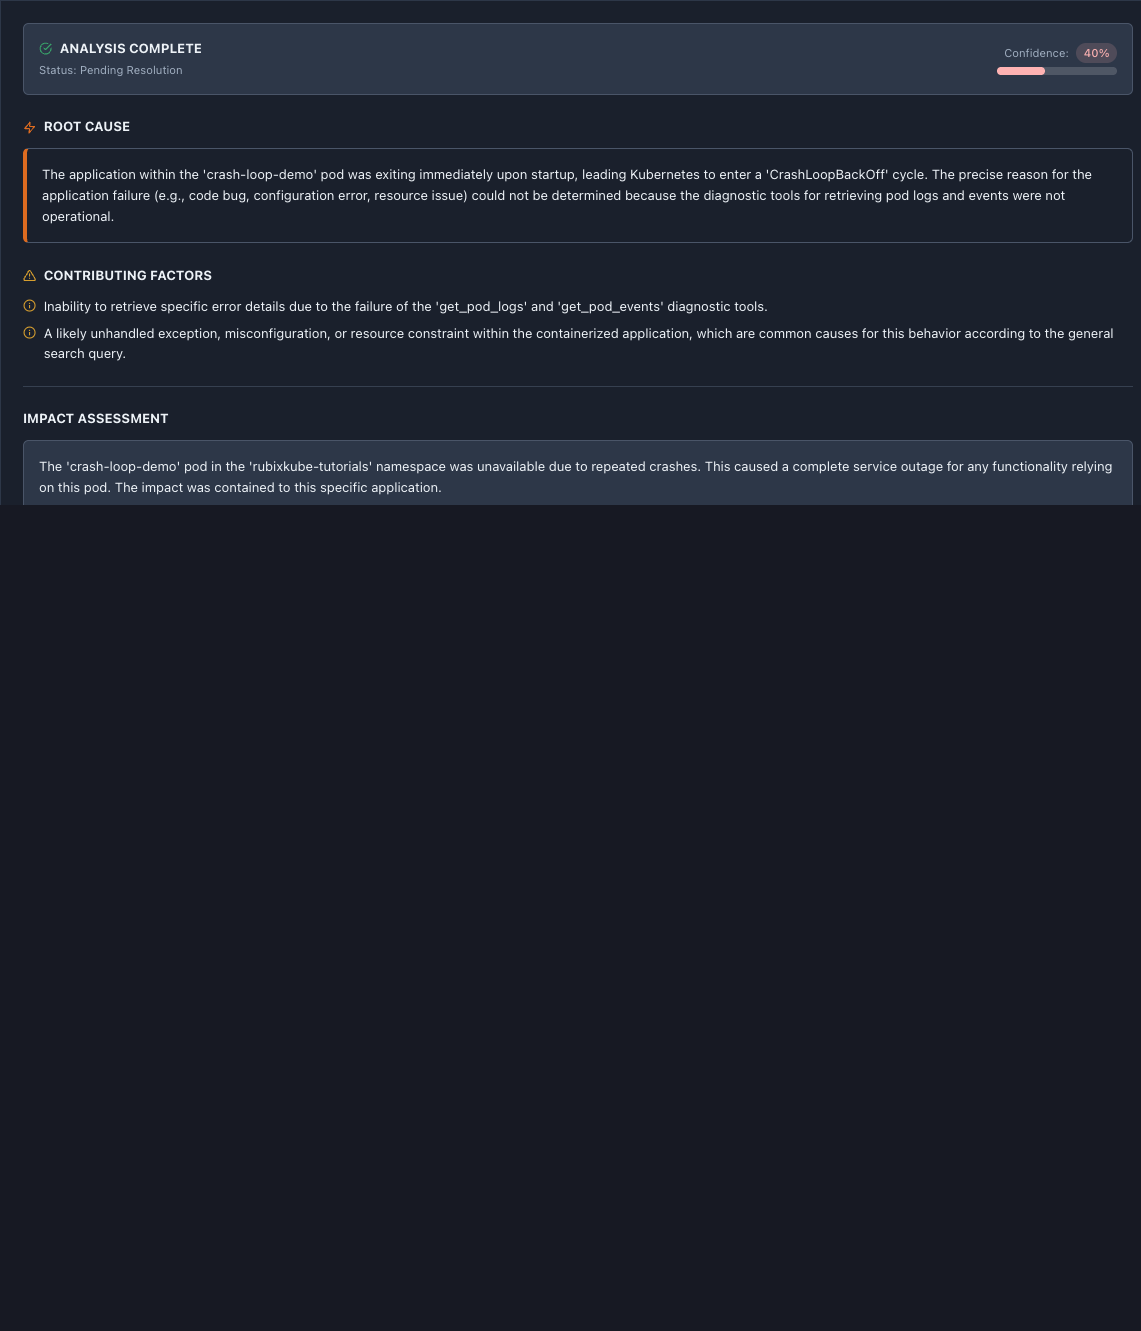 **Click "RCA Analysis" tab** to see complete analysis.
### Analysis Status
**ANALYSIS COMPLETE** - Green checkmark icon
* Status: Pending Resolution
* **Confidence: 40%** with progress bar
**Lower confidence** means more uncertainty - cross-reference with evidence.
***
### ROOT CAUSE
### From our real RCA:
> "The application within the 'crash-loop-demo' pod was exiting immediately upon startup, leading Kubernetes to enter a 'CrashLoopBackOff' cycle. The precise reason for the application failure (e.g., code bug, configuration error, resource issue) could not be determined because the diagnostic tools for retrieving pod logs and events were not operational."
**What this tells you:** - \*\* Primary issue\*\*: Application exits immediately on startup
* **Kubernetes response**: CrashLoopBackOff protection mechanism
* **Limitation**: Diagnostic tools unavailable, preventing deeper analysis
* **Possible causes**: Code bug, config error, or resource constraint
**Orange left border** highlights this as the key finding.
***
### CONTRIBUTING FACTORS
**Warning triangle icon** indicates factors that enabled or worsened the issue:
1.**Inability to retrieve specific error details** due to the failure of the 'get\_pod\_logs' and 'get\_pod\_events' diagnostic tools.
2.**A likely unhandled exception, misconfiguration, or resource constraint** within the containerized application, which are common causes for this behavior according to the general search query.
**These explain WHY** the root cause occurred or why analysis was limited.
***
### IMPACT ASSESSMENT
### Paragraph format explaining business impact:
> "The 'crash-loop-demo' pod in the 'rubixkube-tutorials' namespace was unavailable due to repeated crashes. This caused a complete service outage for any functionality relying on this pod. The impact was contained to this specific application."
**Key information:** - \*\* Scope\*\*: Single pod, single namespace
* **Severity**: Complete service outage for this pod
* **Containment**: No spread to other services
* **Risk**: Low (tutorial namespace, not production)
**AFFECTED SERVICES** subsection:
* **Pod/crash-loop-demo** (clickable resource link)
***
## Recommended Actions
**Click "RCA Analysis" tab** to see complete analysis.
### Analysis Status
**ANALYSIS COMPLETE** - Green checkmark icon
* Status: Pending Resolution
* **Confidence: 40%** with progress bar
**Lower confidence** means more uncertainty - cross-reference with evidence.
***
### ROOT CAUSE
### From our real RCA:
> "The application within the 'crash-loop-demo' pod was exiting immediately upon startup, leading Kubernetes to enter a 'CrashLoopBackOff' cycle. The precise reason for the application failure (e.g., code bug, configuration error, resource issue) could not be determined because the diagnostic tools for retrieving pod logs and events were not operational."
**What this tells you:** - \*\* Primary issue\*\*: Application exits immediately on startup
* **Kubernetes response**: CrashLoopBackOff protection mechanism
* **Limitation**: Diagnostic tools unavailable, preventing deeper analysis
* **Possible causes**: Code bug, config error, or resource constraint
**Orange left border** highlights this as the key finding.
***
### CONTRIBUTING FACTORS
**Warning triangle icon** indicates factors that enabled or worsened the issue:
1.**Inability to retrieve specific error details** due to the failure of the 'get\_pod\_logs' and 'get\_pod\_events' diagnostic tools.
2.**A likely unhandled exception, misconfiguration, or resource constraint** within the containerized application, which are common causes for this behavior according to the general search query.
**These explain WHY** the root cause occurred or why analysis was limited.
***
### IMPACT ASSESSMENT
### Paragraph format explaining business impact:
> "The 'crash-loop-demo' pod in the 'rubixkube-tutorials' namespace was unavailable due to repeated crashes. This caused a complete service outage for any functionality relying on this pod. The impact was contained to this specific application."
**Key information:** - \*\* Scope\*\*: Single pod, single namespace
* **Severity**: Complete service outage for this pod
* **Containment**: No spread to other services
* **Risk**: Low (tutorial namespace, not production)
**AFFECTED SERVICES** subsection:
* **Pod/crash-loop-demo** (clickable resource link)
***
## Recommended Actions
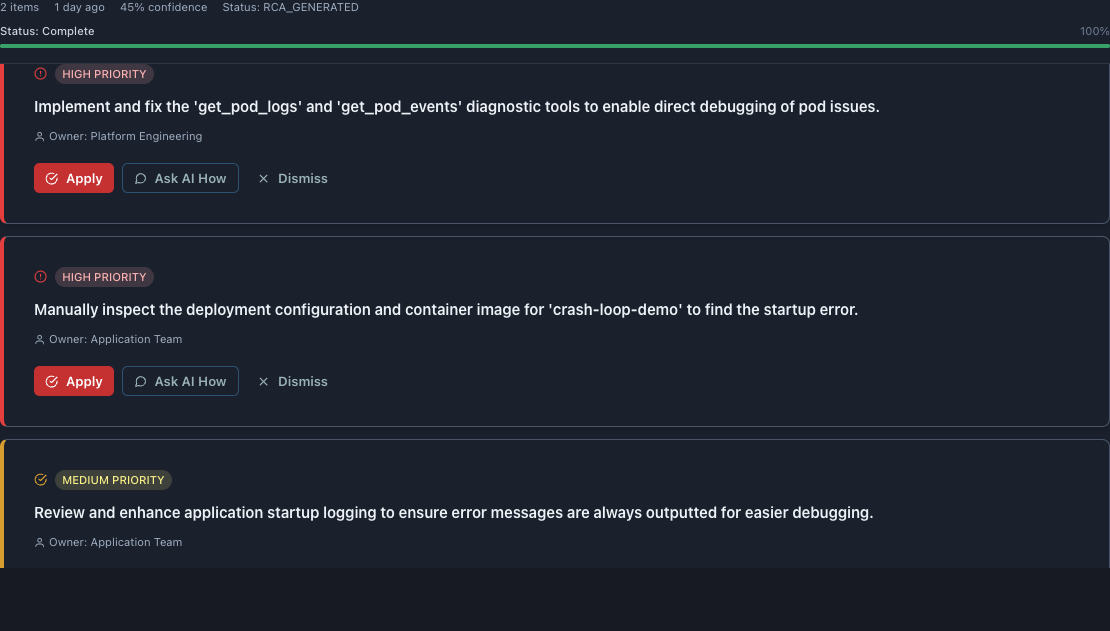 **RECOMMENDED ACTIONS \*\* section shows** RECOMMENDED ACTIONS\*\* prioritized remediation steps.
### Action Card Structure
**Each recommendation includes:** - \*\* Each recommendation includes:\*\* (HIGH PRIORITY or MEDIUM PRIORITY with colored icon)
* **Action description** (what to do)
* **Owner** (who should do it - Platform Engineering, Application Team, etc.)
* **Action buttons**:
* **Apply** - Mark as implemented (red button)
* **Ask AI How** - Get detailed implementation steps from Chat
* **Dismiss** - Mark as not relevant
***
### Real Examples from Our RCA
#### Recommendation #1 (HIGH PRIORITY)
**Action:** > "Implement and fix the 'get\_pod\_logs' and 'get\_pod\_events' diagnostic tools to enable direct debugging of pod issues."
**Owner**: Platform Engineering
**Why HIGH:** - Blocks all future debugging
* Affects entire RubixKube observability
* Prevents accurate RCA for all incidents
**Buttons**: Apply | Ask AI How | Dismiss
***
#### Recommendation #2 (HIGH PRIORITY)
**Action:** > "Manually inspect the deployment configuration and container image for 'crash-loop-demo' to find the startup error."
**Owner**: Application Team
**Why HIGH:** - Directly addresses the failing pod
* Can resolve issue immediately
* Required while diagnostic tools are unavailable
**Buttons**: Apply | Ask AI How | Dismiss
***
#### Recommendation #3 (MEDIUM PRIORITY)
**Action:** > "Review and enhance application startup logging to ensure error messages are always outputted for easier debugging."
**Owner**: Application Team
**Why MEDIUM:** - Preventive measure
* Benefits future incidents
* Not urgent for current issue
**Buttons**: Apply | Ask AI How | Dismiss
***
### Using Action Buttons
**Apply button:** - Click when you've implemented the fix
* Marks recommendation as completed
* Helps track remediation progress
**Ask AI How button:** - Opens Chat with context about this specific action
* Gets step-by-step implementation guidance
* AI has full incident context
**Dismiss button:** - Use if recommendation not applicable
* Removes from active list
* Can undo later
***
## Timeline Tab
**RECOMMENDED ACTIONS \*\* section shows** RECOMMENDED ACTIONS\*\* prioritized remediation steps.
### Action Card Structure
**Each recommendation includes:** - \*\* Each recommendation includes:\*\* (HIGH PRIORITY or MEDIUM PRIORITY with colored icon)
* **Action description** (what to do)
* **Owner** (who should do it - Platform Engineering, Application Team, etc.)
* **Action buttons**:
* **Apply** - Mark as implemented (red button)
* **Ask AI How** - Get detailed implementation steps from Chat
* **Dismiss** - Mark as not relevant
***
### Real Examples from Our RCA
#### Recommendation #1 (HIGH PRIORITY)
**Action:** > "Implement and fix the 'get\_pod\_logs' and 'get\_pod\_events' diagnostic tools to enable direct debugging of pod issues."
**Owner**: Platform Engineering
**Why HIGH:** - Blocks all future debugging
* Affects entire RubixKube observability
* Prevents accurate RCA for all incidents
**Buttons**: Apply | Ask AI How | Dismiss
***
#### Recommendation #2 (HIGH PRIORITY)
**Action:** > "Manually inspect the deployment configuration and container image for 'crash-loop-demo' to find the startup error."
**Owner**: Application Team
**Why HIGH:** - Directly addresses the failing pod
* Can resolve issue immediately
* Required while diagnostic tools are unavailable
**Buttons**: Apply | Ask AI How | Dismiss
***
#### Recommendation #3 (MEDIUM PRIORITY)
**Action:** > "Review and enhance application startup logging to ensure error messages are always outputted for easier debugging."
**Owner**: Application Team
**Why MEDIUM:** - Preventive measure
* Benefits future incidents
* Not urgent for current issue
**Buttons**: Apply | Ask AI How | Dismiss
***
### Using Action Buttons
**Apply button:** - Click when you've implemented the fix
* Marks recommendation as completed
* Helps track remediation progress
**Ask AI How button:** - Opens Chat with context about this specific action
* Gets step-by-step implementation guidance
* AI has full incident context
**Dismiss button:** - Use if recommendation not applicable
* Removes from active list
* Can undo later
***
## Timeline Tab
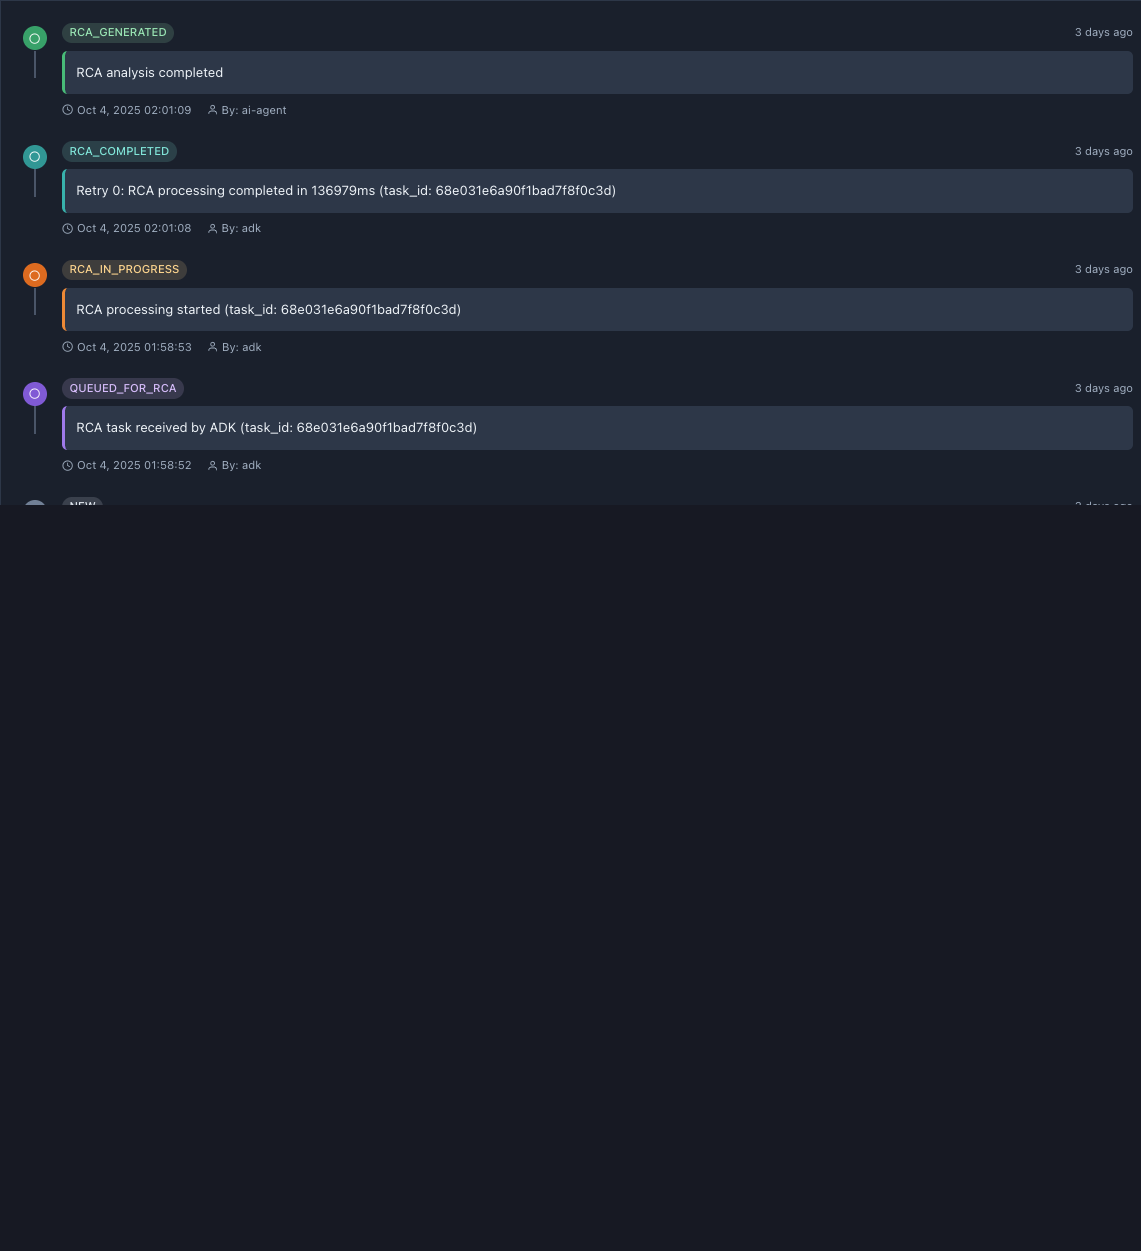 **Click "Timeline" tab** to see incident progression.
### Timeline Structure
**Chronological view** showing:
* Status changes (NEW → QUEUED → IN\_PROGRESS → COMPLETED → GENERATED)
* RCA events (investigation steps)
* Timestamps (date and exact time)
* Actor ("By: observer", "By: adk", "By: rca-agent")
***
### Real Timeline from Our Incident
### Latest to earliest:
#### 1. RCA\_GENERATED (3 days ago)
**Event**: "RCA analysis completed"
**Details:** - Oct 4, 2025 02:01:09
* By: ai-agent
**Meaning**: Final RCA report generated and available
**Green icon** indicates successful completion.
***
#### 2. RCA\_COMPLETED (3 days ago)
**Event**: "Retry 0: RCA processing completed in 136979ms (task\_id: 68e031e6a90f1bad7f8f0c3d)"
**Details:** - Oct 4, 2025 02:01:08
* By: adk (Analysis & Diagnosis Kit)
* Processing time: 137 seconds
**Meaning**: RCA Pipeline finished analysis
**Green icon** indicates successful processing.
***
#### 3. RCA\_IN\_PROGRESS (3 days ago)
**Event**: "RCA processing started (task\_id: 68e031e6a90f1bad7f8f0c3d)"
**Details:** - Oct 4, 2025 01:58:53
* By: adk
**Meaning**: RCA Pipeline began investigating
**Orange icon** indicates active processing.
***
#### 4. QUEUED\_FOR\_RCA (3 days ago)
**Event**: "RCA task received by ADK (task\_id: 68e031e6a90f1bad7f8f0c3d)"
**Details:** - Oct 4, 2025 01:58:52
* By: adk
**Meaning**: Incident queued for RCA analysis
**Purple icon** indicates queued state.
***
### Timeline Benefits
**Use timeline to:** - Understand incident lifecycle
* Calculate time-to-detection (NEW → QUEUED)
* Calculate time-to-analysis (QUEUED → COMPLETED)
* Debug RCA Pipeline issues
* Track investigation steps
* Correlate with external events
**Typical timeline duration:** - Detection to Queue: Seconds
* Queue to In Progress: Seconds
* In Progress to Complete: 30-180 seconds
* Complete to Generated: 1-5 seconds
***
## Evidence Tab
**Click "Timeline" tab** to see incident progression.
### Timeline Structure
**Chronological view** showing:
* Status changes (NEW → QUEUED → IN\_PROGRESS → COMPLETED → GENERATED)
* RCA events (investigation steps)
* Timestamps (date and exact time)
* Actor ("By: observer", "By: adk", "By: rca-agent")
***
### Real Timeline from Our Incident
### Latest to earliest:
#### 1. RCA\_GENERATED (3 days ago)
**Event**: "RCA analysis completed"
**Details:** - Oct 4, 2025 02:01:09
* By: ai-agent
**Meaning**: Final RCA report generated and available
**Green icon** indicates successful completion.
***
#### 2. RCA\_COMPLETED (3 days ago)
**Event**: "Retry 0: RCA processing completed in 136979ms (task\_id: 68e031e6a90f1bad7f8f0c3d)"
**Details:** - Oct 4, 2025 02:01:08
* By: adk (Analysis & Diagnosis Kit)
* Processing time: 137 seconds
**Meaning**: RCA Pipeline finished analysis
**Green icon** indicates successful processing.
***
#### 3. RCA\_IN\_PROGRESS (3 days ago)
**Event**: "RCA processing started (task\_id: 68e031e6a90f1bad7f8f0c3d)"
**Details:** - Oct 4, 2025 01:58:53
* By: adk
**Meaning**: RCA Pipeline began investigating
**Orange icon** indicates active processing.
***
#### 4. QUEUED\_FOR\_RCA (3 days ago)
**Event**: "RCA task received by ADK (task\_id: 68e031e6a90f1bad7f8f0c3d)"
**Details:** - Oct 4, 2025 01:58:52
* By: adk
**Meaning**: Incident queued for RCA analysis
**Purple icon** indicates queued state.
***
### Timeline Benefits
**Use timeline to:** - Understand incident lifecycle
* Calculate time-to-detection (NEW → QUEUED)
* Calculate time-to-analysis (QUEUED → COMPLETED)
* Debug RCA Pipeline issues
* Track investigation steps
* Correlate with external events
**Typical timeline duration:** - Detection to Queue: Seconds
* Queue to In Progress: Seconds
* In Progress to Complete: 30-180 seconds
* Complete to Generated: 1-5 seconds
***
## Evidence Tab
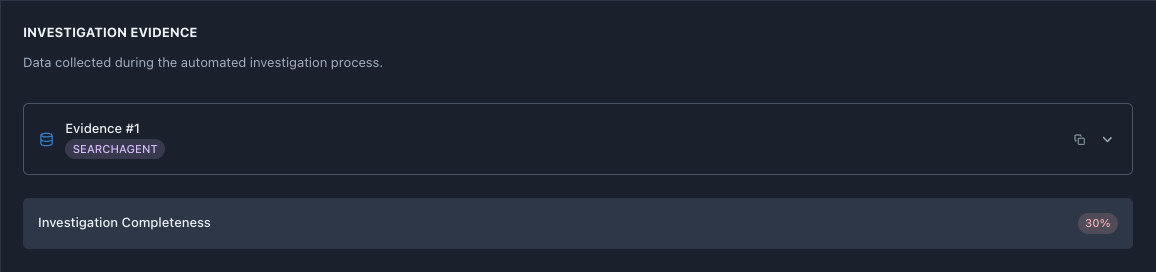 **Click "Evidence" tab** to see data collected during RCA.
### INVESTIGATION EVIDENCE
**Header explains:** - "Data collected during the automated investigation process"
* Shows what RCA Pipeline Agent found
***
### Evidence Items
#### Evidence #1
**Source**: SEARCHAGENT
* Purple document icon
* Expandable card (click to see details)
* Copy button (top right) - copies evidence to clipboard
* Dropdown arrow - expand to read full evidence
**SearchAgent** means RCA performed knowledge base search about this error type.
***
### Investigation Completeness
### Bottom metric **:** 30%
**What it means:** - Investigation gathered 30% of possible evidence
* Low percentage due to diagnostic tool failures (as noted in RCA)
* Higher percentage = more comprehensive analysis
**Why 30% in our case:** - get\_pod\_logs tool failed (would add \~30%)
* get\_pod\_events tool failed (would add \~30%)
* SearchAgent succeeded (contributed 30%)
* Other tools not applicable (remaining 10%)
**Target**: 80%+ for high-confidence RCA
***
## Filtering and Workflows
### Daily Review Workflow
Navigate to Monitoring → Insights
**Look at header:** - RCA coverage below 80%? Investigate why
* Critical Issues > 0? Handle immediately
* High Priority increased? Review new incidents
Click Severity → Check "high"
These need attention within hours
For each HIGH incident:
* Read Root Cause
* Check Confidence level
* Review Recommended Actions
Click "Apply" on each action after implementing
Or "Ask AI How" for guidance
Check incident list next day
Should move to "Resolved" status
***
### Emergency Response Workflow
### When Critical Issues > 0:
Severity → critical (shows only critical incidents)
Click critical incident to expand
Go to RCA Analysis tab
Understand: What's affected? How many users?
Scroll to actions section
Start with HIGH priority items
Click "Ask AI How" on most urgent action
Chat provides step-by-step resolution
Implement fixes, monitor for resolution
Mark actions as Applied when done
***
### Troubleshooting Workflow
### When RCA confidence is low (below 50%):
See what data was collected
Look for Investigation Completeness %
Check if RCA completed successfully
Look for errors or warnings
If tools failed, investigate manually:
```
kubectl logs
kubectl describe pod
kubectl get events
```
Click "Provide to Chat Context"
Ask Chat to help interpret evidence
Contact support with findings
Helps improve future RCA accuracy
***
## Understanding RCA Confidence Levels
| Confidence | Meaning | What to Do |
| ---------------- | ---------------------------- | --------------------------------------------------- |
| \*\* 90-100%\*\* | High confidence in diagnosis | Trust and implement recommendations immediately |
| \*\* 70-89%\*\* | Good confidence | Review evidence, recommendations likely correct |
| \*\* 50-69%\*\* | Moderate confidence | Cross-check with Evidence tab, verify before acting |
| **Below 50%** | Low confidence | Manual investigation needed, use Chat for help |
**From our example**: 40-50% confidence
* Indicates uncertainty due to diagnostic tool failures
* Recommendations still valuable but require validation
* Manual inspection recommended before implementing
***
## Incident Lifecycle States
### State Diagram
```
NEW → QUEUED_FOR_RCA → RCA_IN_PROGRESS → RCA_COMPLETED → RCA_GENERATED → Resolved
```
### State Definitions
**NEW** - Incident just detected by Observer
* No RCA initiated yet
* Usually lasts: Seconds
**QUEUED\_FOR\_RCA** - Sent to RCA Pipeline queue
* Waiting for processing slot
* Usually lasts: Seconds
**RCA\_IN\_PROGRESS** - RCA Pipeline actively investigating
* Gathering logs, events, metrics
* Usually lasts: 30-180 seconds
**RCA\_COMPLETED** - Investigation finished
* Report being generated
* Usually lasts: 1-5 seconds
**RCA\_GENERATED** - Report available in UI
* Recommendations ready
* Stays until resolved
**Resolved** - Issue fixed and verified
* RubixKube detected resolution
* Archived for learning
***
## Integration with Other Features
### Insights → Chat
**Button**: "Ask AI" or "Provide to Chat Context"
**What it does:** - Sends full incident context to Chat
* Includes RCA, evidence, timeline
* Chat can answer follow-up questions
**Example questions to ask:**
```
"Explain this incident in simple terms"
"How do I implement recommendation #1?"
"Has this pod failed before?"
"What are similar incidents in the past?"
```
***
### Insights → Dashboard
**From Dashboard Activity Feed** → Click event → Opens in Insights
**Use case:** - You see "OOMKilled" in Dashboard feed
* Click to see full RCA
* Opens Insights with incident expanded
**Bi-directional navigation** keeps context flowing.
***
### Insights → Memory Engine
**Automatic integration:** - Every resolved incident stored
* Root causes saved to knowledge base
* Resolution patterns learned
* Speeds up future RCA
**You don't see this** - happens in background.
**Benefit**: Each incident makes RubixKube smarter for next time.
***
## Best Practices
### Morning routine:
1. Open Insights page
2. Check RCA coverage (target: 80%+)
3. Filter by HIGH severity
4. Review new incidents since yesterday
5. Apply recommended actions
**Time required**: 5-10 minutes
**Benefit**: Proactive issue resolution before escalation
### Priority order:
**critical** (red badge)
* Drop everything, resolve immediately
* System-wide impact
* Data loss risk
**high** (red badge)
* Resolve within hours
* Significant user impact
* Service degradation
**medium** (yellow badge)
* Resolve within 1-2 days
* Moderate impact
* Workarounds exist
**low** (gray badge)
* Resolve next sprint
* Minimal impact
* Informational
**Always check header** "Critical Issues" and "High Priority" counts first.
### When confidence is 70%+:
* Implement recommendations directly
* No need for extensive validation
* RubixKube has solid evidence
### When confidence is below 70%:
* Review Evidence tab carefully
* Cross-check with manual investigation
* Use "Ask AI How" for guidance
* Validate before implementing
**Our example** (40-50% confidence):
* Due to diagnostic tool failures
* Manual verification needed
* Still provides valuable direction
### Common filter combinations:
**Production-only incidents:** - Namespace: production
* Severity: high, critical
**Recent failures:** - Status: Active
* Sort: Newest
**Specific pod issues:** - Search: "pod-name"
* Issue Type: CrashLoop, OOMKilled
**Unresolved RCA:** - Status: Active
* Only show incidents with RCA badge
**Pro tip**: Clear filters between sessions using "Clear filters" button
### After fixing an incident:
1. Click "Apply" on each implemented recommendation
2. Add notes in "More actions" menu (if available)
3. Take screenshot of RCA for postmortem
4. Share learnings with team
**Why this matters:** - Builds organizational knowledge
* Helps Memory Engine learn faster
* Creates audit trail
* Prevents repeated incidents
**Future enhancement**: RubixKube will auto-detect resolutions
### Don't investigate alone:
**For every incident:** - Click "Ask AI" button
* Chat has full context already
* Ask for explanations, steps, similar incidents
**Example workflow:** 1. See OOMKilled incident
2\. Click "Ask AI"
3\. Ask: "Show me memory usage trends"
4\. Ask: "What should I set the memory limit to?"
5\. Ask: "Has this pod OOMKilled before?"
**Chat makes RCA actionable** with interactive guidance.
***
## Quick Reference
### Insights Page Elements
| Element | Purpose | Action |
| -------------------- | ----------------------------- | --------------------------------------- |
| **Health Metrics** | Overview of incident coverage | Check daily, target 80%+ RCA coverage |
| **Search Bar** | Find specific incidents | Type pod name, namespace, or error type |
| **Severity Filter** | Prioritize by impact | Filter for "high" and "critical" first |
| **Incident Cards** | List all incident groups | Click to expand details |
| **RCA Analysis Tab** | Root cause findings | Read before taking action |
| **Recommendations** | Prioritized fixes | Click "Apply" or "Ask AI How" |
| **Timeline Tab** | Incident progression | Use for debugging RCA issues |
| **Evidence Tab** | Investigation data | Review for low-confidence RCA |
***
### Keyboard Shortcuts
While on Insights page:
* `R` - Refresh data
* `F` - Focus search bar
* `1-4` - Jump to first 4 incidents
* `Tab` - Navigate between tabs (Overview, RCA, Timeline, Evidence)
* `Esc` - Close expanded incident
*(Note: Keyboard shortcuts may vary by implementation)*
***
## Common Scenarios
### Scenario 1: New OOMKilled Incident
**What you see:** - HIGH severity badge
* "OOMKilled in Pod/memory-hog-demo"
* RCA badge present
### What to do:
1. Click incident to expand
2. Go to RCA Analysis tab
3. Read Root Cause (memory limit too low)
4. Check Recommended Actions
5. Click "Ask AI How" on "Increase memory limit" action
6. Implement suggested limit (e.g., increase from 50Mi to 150Mi)
7. Click "Apply" when done
8. Monitor for resolution
**Expected outcome**: Pod stops crashing, incident auto-resolves.
***
### Scenario 2: Low RCA Confidence
**What you see:** - Incident with 40% confidence
* "Status: RCA\_GENERATED" but low certainty
### What to do:
1. Click Evidence tab
2. Check Investigation Completeness (30%)
3. See which tools failed (e.g., get\_pod\_logs)
4. Perform manual investigation:
```
kubectl logs crash-loop-demo -n rubixkube-tutorials
kubectl describe pod crash-loop-demo -n rubixkube-tutorials
```
5. Click "Ask AI" with manual findings
6. Chat combines RCA + your data for better diagnosis
**Key lesson**: Low confidence doesn't mean wrong, just uncertain.
***
### Scenario 3: Incident Without RCA
**What you see:** - "PodPending in Pod/broken-image-demo"
* No RCA badge
* Only shows Suggestions (not full RCA)
**Why this happens:** - RCA not complete yet (check Timeline)
* RCA failed (check Timeline for errors)
* Incident type doesn't trigger RCA
* RCA Pipeline agent offline
### What to do:
1. Check Timeline tab for RCA status
2. If "QUEUED\_FOR\_RCA" but no progress:
* RCA Pipeline may be stuck
* Go to Agents page, check RCA Pipeline Agent
3. If no RCA triggered:
* Use Suggestions section for generic fixes
* Click "Ask AI" for Chat investigation
4. Manual investigation:
```
kubectl describe pod broken-image-demo -n rubixkube-tutorials
```
Look for ImagePullBackOff errors
***
### Scenario 4: Multiple Related Incidents
**What you see:** - "CrashLoop in Pod/memory-hog-demo" (MEDIUM)
* "OOMKilled in Pod/memory-hog-demo" (HIGH)
* Same pod, different incident types
**What this means:** - Pod crashed due to OOM
* OOM is root cause
* CrashLoop is symptom
### What to do:
1. Open HIGH severity incident first (OOMKilled)
2. Read RCA (memory limit too low)
3. Fix memory limit
4. Both incidents should resolve together
5. Mark both as related in notes
**Pro tip**: RubixKube groups related incidents when possible.
***
## Troubleshooting Insights Issues
### Insights page not loading
**Symptoms**: Spinner forever, "Loading insights..." never completes
**Causes:** - Backend API connection issue
* RCA Pipeline not responding
* Database query timeout
### Solutions:
1. Hard refresh: Cmd+Shift+R (Mac) or Ctrl+Shift+R (Windows)
2. Check Dashboard → Agents → Verify RCA Pipeline is active
3. Check browser console for errors
4. Try different browser
5. Contact support if persists
***
### RCA not generating
**Symptoms**: Incidents stuck in "QUEUED\_FOR\_RCA" for >5 minutes
**Causes:** - RCA Pipeline Agent offline
* Task queue full
* Resource constraints
### Solutions:
1. Go to Agents page
2. Check RCA Pipeline Agent status
3. If degraded, restart:
```
kubectl rollout restart deployment/rca-pipeline -n rubixkube-system
```
4. Check Timeline tab for error messages
5. Verify cluster has resources for RCA workload
***
### Low RCA coverage (below 60%)
**Symptoms**: "Health: 55% RCA coverage" in header
**Causes:** - Many incidents without RCA
* RCA failures
* Complex incidents taking longer
### Solutions:
1. Filter by Status: Active, no RCA badge
2. Check those incidents' Timeline tabs for RCA failures
3. Verify diagnostic tools working (get\_pod\_logs, get\_pod\_events)
4. Check RCA Pipeline Agent logs:
```
kubectl logs -l app=rca-pipeline -n rubixkube-system --tail=100
```
5. May need to tune RCA timeout settings in Settings
***
### Evidence completeness always low
**Symptoms**: Investigation Completeness consistently 30-40%
**Causes:** - Diagnostic tools failing
* Permission issues
* Missing integrations
### Solutions:
1. Check which tools are failing (Evidence tab shows source)
2. Verify RubixKube has proper RBAC permissions:
```
kubectl auth can-i get pods --as=system:serviceaccount:rubixkube-system:rubixkube-observer
kubectl auth can-i get events --as=system:serviceaccount:rubixkube-system:rubixkube-observer
```
3. Check integration connections in Settings → Integrations
4. Review RubixKube Observer Agent logs for errors
***
## What You Learned
* 75% RCA coverage
* 4 total incident groups
* 0 critical, 1 high priority
* Daily monitoring targets
* Severity levels (critical, high, medium, low)
* Incident groups and items
* Status lifecycle (NEW → RESOLVED)
* RCA badges and completion
* Root Cause identification
* Contributing Factors analysis
* Impact Assessment scope
* Confidence levels explained
* Prioritized actions (HIGH/MEDIUM)
* Owner assignments
* Apply/Ask AI How/Dismiss buttons
* Remediation tracking
* Chronological event progression
* RCA processing states
* Investigation duration
* Actor attribution
* Investigation completeness percentage
* Data sources (SearchAgent, logs, events)
* Diagnostic tool status
* Copy and share evidence
* Search by name/namespace/type
* Severity, Issue Type, Namespace, Status
* Multiple selection support
* Clear filters button
* Daily review routine
* Emergency response steps
* Troubleshooting approach
* Integration with Chat
***
## Next Steps
Monitor overall system health and active incidents
Ask AI about incidents with full RCA context
See affected resources in topology view
Verify RCA Pipeline and Observer agents are healthy
***
## Related Documentation
Learn how RCA Pipeline generates analysis
Understand Site Reliability Intelligence philosophy
How RubixKube learns from past incidents
Safety measures and confidence thresholds
***
## Need Help?
Email: [connect@rubixkube.ai](mailto:connect@rubixkube.ai)
**Click "Evidence" tab** to see data collected during RCA.
### INVESTIGATION EVIDENCE
**Header explains:** - "Data collected during the automated investigation process"
* Shows what RCA Pipeline Agent found
***
### Evidence Items
#### Evidence #1
**Source**: SEARCHAGENT
* Purple document icon
* Expandable card (click to see details)
* Copy button (top right) - copies evidence to clipboard
* Dropdown arrow - expand to read full evidence
**SearchAgent** means RCA performed knowledge base search about this error type.
***
### Investigation Completeness
### Bottom metric **:** 30%
**What it means:** - Investigation gathered 30% of possible evidence
* Low percentage due to diagnostic tool failures (as noted in RCA)
* Higher percentage = more comprehensive analysis
**Why 30% in our case:** - get\_pod\_logs tool failed (would add \~30%)
* get\_pod\_events tool failed (would add \~30%)
* SearchAgent succeeded (contributed 30%)
* Other tools not applicable (remaining 10%)
**Target**: 80%+ for high-confidence RCA
***
## Filtering and Workflows
### Daily Review Workflow
Navigate to Monitoring → Insights
**Look at header:** - RCA coverage below 80%? Investigate why
* Critical Issues > 0? Handle immediately
* High Priority increased? Review new incidents
Click Severity → Check "high"
These need attention within hours
For each HIGH incident:
* Read Root Cause
* Check Confidence level
* Review Recommended Actions
Click "Apply" on each action after implementing
Or "Ask AI How" for guidance
Check incident list next day
Should move to "Resolved" status
***
### Emergency Response Workflow
### When Critical Issues > 0:
Severity → critical (shows only critical incidents)
Click critical incident to expand
Go to RCA Analysis tab
Understand: What's affected? How many users?
Scroll to actions section
Start with HIGH priority items
Click "Ask AI How" on most urgent action
Chat provides step-by-step resolution
Implement fixes, monitor for resolution
Mark actions as Applied when done
***
### Troubleshooting Workflow
### When RCA confidence is low (below 50%):
See what data was collected
Look for Investigation Completeness %
Check if RCA completed successfully
Look for errors or warnings
If tools failed, investigate manually:
```
kubectl logs
kubectl describe pod
kubectl get events
```
Click "Provide to Chat Context"
Ask Chat to help interpret evidence
Contact support with findings
Helps improve future RCA accuracy
***
## Understanding RCA Confidence Levels
| Confidence | Meaning | What to Do |
| ---------------- | ---------------------------- | --------------------------------------------------- |
| \*\* 90-100%\*\* | High confidence in diagnosis | Trust and implement recommendations immediately |
| \*\* 70-89%\*\* | Good confidence | Review evidence, recommendations likely correct |
| \*\* 50-69%\*\* | Moderate confidence | Cross-check with Evidence tab, verify before acting |
| **Below 50%** | Low confidence | Manual investigation needed, use Chat for help |
**From our example**: 40-50% confidence
* Indicates uncertainty due to diagnostic tool failures
* Recommendations still valuable but require validation
* Manual inspection recommended before implementing
***
## Incident Lifecycle States
### State Diagram
```
NEW → QUEUED_FOR_RCA → RCA_IN_PROGRESS → RCA_COMPLETED → RCA_GENERATED → Resolved
```
### State Definitions
**NEW** - Incident just detected by Observer
* No RCA initiated yet
* Usually lasts: Seconds
**QUEUED\_FOR\_RCA** - Sent to RCA Pipeline queue
* Waiting for processing slot
* Usually lasts: Seconds
**RCA\_IN\_PROGRESS** - RCA Pipeline actively investigating
* Gathering logs, events, metrics
* Usually lasts: 30-180 seconds
**RCA\_COMPLETED** - Investigation finished
* Report being generated
* Usually lasts: 1-5 seconds
**RCA\_GENERATED** - Report available in UI
* Recommendations ready
* Stays until resolved
**Resolved** - Issue fixed and verified
* RubixKube detected resolution
* Archived for learning
***
## Integration with Other Features
### Insights → Chat
**Button**: "Ask AI" or "Provide to Chat Context"
**What it does:** - Sends full incident context to Chat
* Includes RCA, evidence, timeline
* Chat can answer follow-up questions
**Example questions to ask:**
```
"Explain this incident in simple terms"
"How do I implement recommendation #1?"
"Has this pod failed before?"
"What are similar incidents in the past?"
```
***
### Insights → Dashboard
**From Dashboard Activity Feed** → Click event → Opens in Insights
**Use case:** - You see "OOMKilled" in Dashboard feed
* Click to see full RCA
* Opens Insights with incident expanded
**Bi-directional navigation** keeps context flowing.
***
### Insights → Memory Engine
**Automatic integration:** - Every resolved incident stored
* Root causes saved to knowledge base
* Resolution patterns learned
* Speeds up future RCA
**You don't see this** - happens in background.
**Benefit**: Each incident makes RubixKube smarter for next time.
***
## Best Practices
### Morning routine:
1. Open Insights page
2. Check RCA coverage (target: 80%+)
3. Filter by HIGH severity
4. Review new incidents since yesterday
5. Apply recommended actions
**Time required**: 5-10 minutes
**Benefit**: Proactive issue resolution before escalation
### Priority order:
**critical** (red badge)
* Drop everything, resolve immediately
* System-wide impact
* Data loss risk
**high** (red badge)
* Resolve within hours
* Significant user impact
* Service degradation
**medium** (yellow badge)
* Resolve within 1-2 days
* Moderate impact
* Workarounds exist
**low** (gray badge)
* Resolve next sprint
* Minimal impact
* Informational
**Always check header** "Critical Issues" and "High Priority" counts first.
### When confidence is 70%+:
* Implement recommendations directly
* No need for extensive validation
* RubixKube has solid evidence
### When confidence is below 70%:
* Review Evidence tab carefully
* Cross-check with manual investigation
* Use "Ask AI How" for guidance
* Validate before implementing
**Our example** (40-50% confidence):
* Due to diagnostic tool failures
* Manual verification needed
* Still provides valuable direction
### Common filter combinations:
**Production-only incidents:** - Namespace: production
* Severity: high, critical
**Recent failures:** - Status: Active
* Sort: Newest
**Specific pod issues:** - Search: "pod-name"
* Issue Type: CrashLoop, OOMKilled
**Unresolved RCA:** - Status: Active
* Only show incidents with RCA badge
**Pro tip**: Clear filters between sessions using "Clear filters" button
### After fixing an incident:
1. Click "Apply" on each implemented recommendation
2. Add notes in "More actions" menu (if available)
3. Take screenshot of RCA for postmortem
4. Share learnings with team
**Why this matters:** - Builds organizational knowledge
* Helps Memory Engine learn faster
* Creates audit trail
* Prevents repeated incidents
**Future enhancement**: RubixKube will auto-detect resolutions
### Don't investigate alone:
**For every incident:** - Click "Ask AI" button
* Chat has full context already
* Ask for explanations, steps, similar incidents
**Example workflow:** 1. See OOMKilled incident
2\. Click "Ask AI"
3\. Ask: "Show me memory usage trends"
4\. Ask: "What should I set the memory limit to?"
5\. Ask: "Has this pod OOMKilled before?"
**Chat makes RCA actionable** with interactive guidance.
***
## Quick Reference
### Insights Page Elements
| Element | Purpose | Action |
| -------------------- | ----------------------------- | --------------------------------------- |
| **Health Metrics** | Overview of incident coverage | Check daily, target 80%+ RCA coverage |
| **Search Bar** | Find specific incidents | Type pod name, namespace, or error type |
| **Severity Filter** | Prioritize by impact | Filter for "high" and "critical" first |
| **Incident Cards** | List all incident groups | Click to expand details |
| **RCA Analysis Tab** | Root cause findings | Read before taking action |
| **Recommendations** | Prioritized fixes | Click "Apply" or "Ask AI How" |
| **Timeline Tab** | Incident progression | Use for debugging RCA issues |
| **Evidence Tab** | Investigation data | Review for low-confidence RCA |
***
### Keyboard Shortcuts
While on Insights page:
* `R` - Refresh data
* `F` - Focus search bar
* `1-4` - Jump to first 4 incidents
* `Tab` - Navigate between tabs (Overview, RCA, Timeline, Evidence)
* `Esc` - Close expanded incident
*(Note: Keyboard shortcuts may vary by implementation)*
***
## Common Scenarios
### Scenario 1: New OOMKilled Incident
**What you see:** - HIGH severity badge
* "OOMKilled in Pod/memory-hog-demo"
* RCA badge present
### What to do:
1. Click incident to expand
2. Go to RCA Analysis tab
3. Read Root Cause (memory limit too low)
4. Check Recommended Actions
5. Click "Ask AI How" on "Increase memory limit" action
6. Implement suggested limit (e.g., increase from 50Mi to 150Mi)
7. Click "Apply" when done
8. Monitor for resolution
**Expected outcome**: Pod stops crashing, incident auto-resolves.
***
### Scenario 2: Low RCA Confidence
**What you see:** - Incident with 40% confidence
* "Status: RCA\_GENERATED" but low certainty
### What to do:
1. Click Evidence tab
2. Check Investigation Completeness (30%)
3. See which tools failed (e.g., get\_pod\_logs)
4. Perform manual investigation:
```
kubectl logs crash-loop-demo -n rubixkube-tutorials
kubectl describe pod crash-loop-demo -n rubixkube-tutorials
```
5. Click "Ask AI" with manual findings
6. Chat combines RCA + your data for better diagnosis
**Key lesson**: Low confidence doesn't mean wrong, just uncertain.
***
### Scenario 3: Incident Without RCA
**What you see:** - "PodPending in Pod/broken-image-demo"
* No RCA badge
* Only shows Suggestions (not full RCA)
**Why this happens:** - RCA not complete yet (check Timeline)
* RCA failed (check Timeline for errors)
* Incident type doesn't trigger RCA
* RCA Pipeline agent offline
### What to do:
1. Check Timeline tab for RCA status
2. If "QUEUED\_FOR\_RCA" but no progress:
* RCA Pipeline may be stuck
* Go to Agents page, check RCA Pipeline Agent
3. If no RCA triggered:
* Use Suggestions section for generic fixes
* Click "Ask AI" for Chat investigation
4. Manual investigation:
```
kubectl describe pod broken-image-demo -n rubixkube-tutorials
```
Look for ImagePullBackOff errors
***
### Scenario 4: Multiple Related Incidents
**What you see:** - "CrashLoop in Pod/memory-hog-demo" (MEDIUM)
* "OOMKilled in Pod/memory-hog-demo" (HIGH)
* Same pod, different incident types
**What this means:** - Pod crashed due to OOM
* OOM is root cause
* CrashLoop is symptom
### What to do:
1. Open HIGH severity incident first (OOMKilled)
2. Read RCA (memory limit too low)
3. Fix memory limit
4. Both incidents should resolve together
5. Mark both as related in notes
**Pro tip**: RubixKube groups related incidents when possible.
***
## Troubleshooting Insights Issues
### Insights page not loading
**Symptoms**: Spinner forever, "Loading insights..." never completes
**Causes:** - Backend API connection issue
* RCA Pipeline not responding
* Database query timeout
### Solutions:
1. Hard refresh: Cmd+Shift+R (Mac) or Ctrl+Shift+R (Windows)
2. Check Dashboard → Agents → Verify RCA Pipeline is active
3. Check browser console for errors
4. Try different browser
5. Contact support if persists
***
### RCA not generating
**Symptoms**: Incidents stuck in "QUEUED\_FOR\_RCA" for >5 minutes
**Causes:** - RCA Pipeline Agent offline
* Task queue full
* Resource constraints
### Solutions:
1. Go to Agents page
2. Check RCA Pipeline Agent status
3. If degraded, restart:
```
kubectl rollout restart deployment/rca-pipeline -n rubixkube-system
```
4. Check Timeline tab for error messages
5. Verify cluster has resources for RCA workload
***
### Low RCA coverage (below 60%)
**Symptoms**: "Health: 55% RCA coverage" in header
**Causes:** - Many incidents without RCA
* RCA failures
* Complex incidents taking longer
### Solutions:
1. Filter by Status: Active, no RCA badge
2. Check those incidents' Timeline tabs for RCA failures
3. Verify diagnostic tools working (get\_pod\_logs, get\_pod\_events)
4. Check RCA Pipeline Agent logs:
```
kubectl logs -l app=rca-pipeline -n rubixkube-system --tail=100
```
5. May need to tune RCA timeout settings in Settings
***
### Evidence completeness always low
**Symptoms**: Investigation Completeness consistently 30-40%
**Causes:** - Diagnostic tools failing
* Permission issues
* Missing integrations
### Solutions:
1. Check which tools are failing (Evidence tab shows source)
2. Verify RubixKube has proper RBAC permissions:
```
kubectl auth can-i get pods --as=system:serviceaccount:rubixkube-system:rubixkube-observer
kubectl auth can-i get events --as=system:serviceaccount:rubixkube-system:rubixkube-observer
```
3. Check integration connections in Settings → Integrations
4. Review RubixKube Observer Agent logs for errors
***
## What You Learned
* 75% RCA coverage
* 4 total incident groups
* 0 critical, 1 high priority
* Daily monitoring targets
* Severity levels (critical, high, medium, low)
* Incident groups and items
* Status lifecycle (NEW → RESOLVED)
* RCA badges and completion
* Root Cause identification
* Contributing Factors analysis
* Impact Assessment scope
* Confidence levels explained
* Prioritized actions (HIGH/MEDIUM)
* Owner assignments
* Apply/Ask AI How/Dismiss buttons
* Remediation tracking
* Chronological event progression
* RCA processing states
* Investigation duration
* Actor attribution
* Investigation completeness percentage
* Data sources (SearchAgent, logs, events)
* Diagnostic tool status
* Copy and share evidence
* Search by name/namespace/type
* Severity, Issue Type, Namespace, Status
* Multiple selection support
* Clear filters button
* Daily review routine
* Emergency response steps
* Troubleshooting approach
* Integration with Chat
***
## Next Steps
Monitor overall system health and active incidents
Ask AI about incidents with full RCA context
See affected resources in topology view
Verify RCA Pipeline and Observer agents are healthy
***
## Related Documentation
Learn how RCA Pipeline generates analysis
Understand Site Reliability Intelligence philosophy
How RubixKube learns from past incidents
Safety measures and confidence thresholds
***
## Need Help?
Email: [connect@rubixkube.ai](mailto:connect@rubixkube.ai)
Please include your Tenant ID (Settings → Organization), timestamp, and screenshots.
Step-by-step fixes for common issues across Dashboard, Insights, Agents, and more.
Answers to common questions about setup, RCA, agents, and docs.
Browse all guides to learn workflows and best practices.
***
## Feedback
Found an issue with this guide or have suggestions?
-**Email** : [connect@rubixkube.ai](mailto:connect@rubixkube.ai)
-**Subject** : "Insights Guide Feedback"
***
*Last updated: October 6, 2025*
*Guide version: 2.0*
*Based on RubixKube Console v1.0*
***
## Related Guides
* [Dashboard](/using/dashboard)
* [Infrastructure](/using/infrastructure)
* [Agents](/using/agents)
* [Clusters](/using/clusters)
* [Workspace](/using/workspace)
* [Settings](/using/settings)
* [Integrations](/using/integrations)