> ## Documentation Index
> Fetch the complete documentation index at: https://docs.rubixkube.ai/llms.txt
> Use this file to discover all available pages before exploring further.
# Infrastructure Topology
> Visualise and navigate your infrastructure with interactive topology views across Kubernetes, AWS, GCP, and VMs.
# Using Infrastructure Topology
The Infrastructure page provides an interactive, end-to-end map of your Kubernetes cluster. Use it to understand relationships between resources, assess health, and drill into details using multiple view modes.
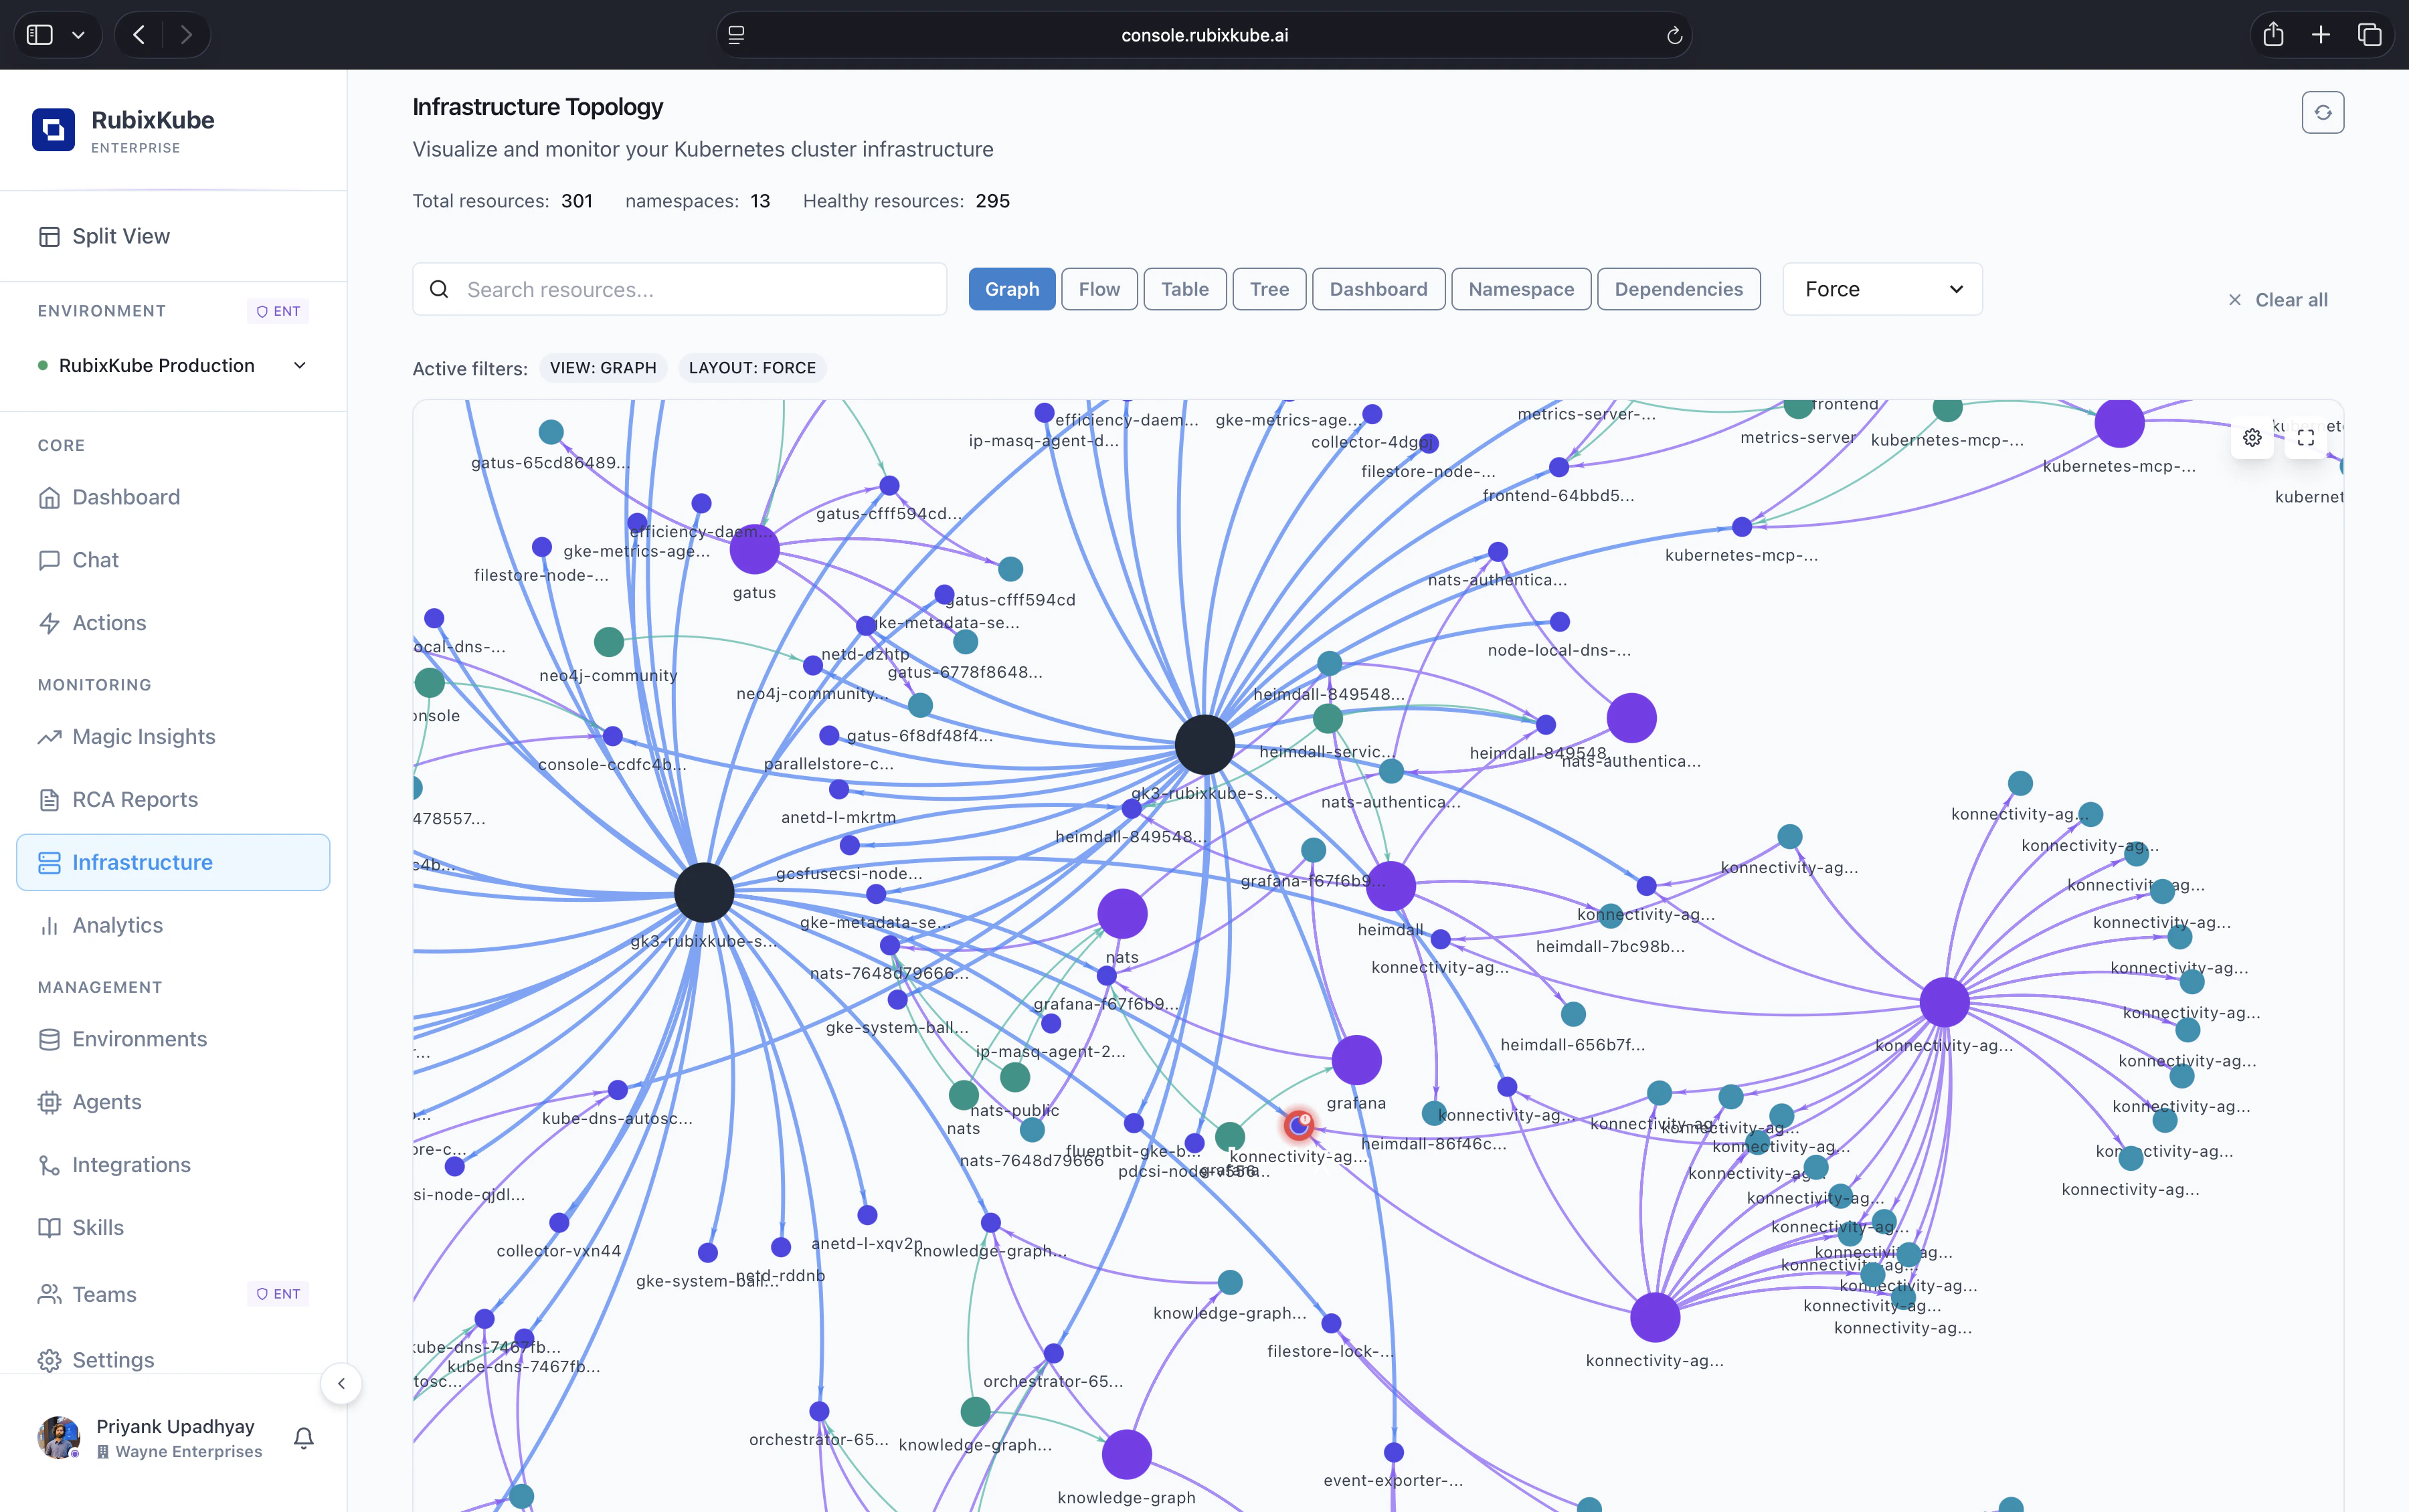 Infrastructure Topology. Counters for total resources, namespaces, and healthy resources, then an interactive graph you can switch between Graph, Flow, Table, Tree, Dashboard, Namespace, and Dependencies views.
***
## Header and Global Controls
Infrastructure Topology. Counters for total resources, namespaces, and healthy resources, then an interactive graph you can switch between Graph, Flow, Table, Tree, Dashboard, Namespace, and Dependencies views.
***
## Header and Global Controls
 Header with title, description, and Refresh action
* **Title and description**: Confirms you are in Infrastructure Topology.
* **Refresh**: Re-fetches topology and metrics. Use after deployments or scaling events.
***
## Metrics Summary
Header with title, description, and Refresh action
* **Title and description**: Confirms you are in Infrastructure Topology.
* **Refresh**: Re-fetches topology and metrics. Use after deployments or scaling events.
***
## Metrics Summary
 Summary metrics sourced live from the cluster
* **Total Resources**: Count of all resources indexed in the current cluster view.
* **Namespaces**: Distinct namespaces represented in the current data set.
* **Healthy Resources**: Resources reporting healthy state.
***
## Controls: Search, Views, Layout
Summary metrics sourced live from the cluster
* **Total Resources**: Count of all resources indexed in the current cluster view.
* **Namespaces**: Distinct namespaces represented in the current data set.
* **Healthy Resources**: Resources reporting healthy state.
***
## Controls: Search, Views, Layout
 Controls: search, view mode selector, and graph layout selector
* **Search resources...**: Type names, kinds, or namespaces to filter results instantly.
* **View modes**: Graph, Flow, Table, Tree, Dashboard, Namespace, Dependencies.
* **Layout selector** (Graph view): Hierarchical, Force, Circular, Tree, Grid.
* **Clear all**: Removes active filters and resets controls.
Active filters reflect your selections in real time:
Controls: search, view mode selector, and graph layout selector
* **Search resources...**: Type names, kinds, or namespaces to filter results instantly.
* **View modes**: Graph, Flow, Table, Tree, Dashboard, Namespace, Dependencies.
* **Layout selector** (Graph view): Hierarchical, Force, Circular, Tree, Grid.
* **Clear all**: Removes active filters and resets controls.
Active filters reflect your selections in real time:
 Active filters chips showing current selections
***
## Graph View
Graph view renders resources as nodes with relationships as edges. Use it to reason about dependencies and blast radius.
Active filters chips showing current selections
***
## Graph View
Graph view renders resources as nodes with relationships as edges. Use it to reason about dependencies and blast radius.
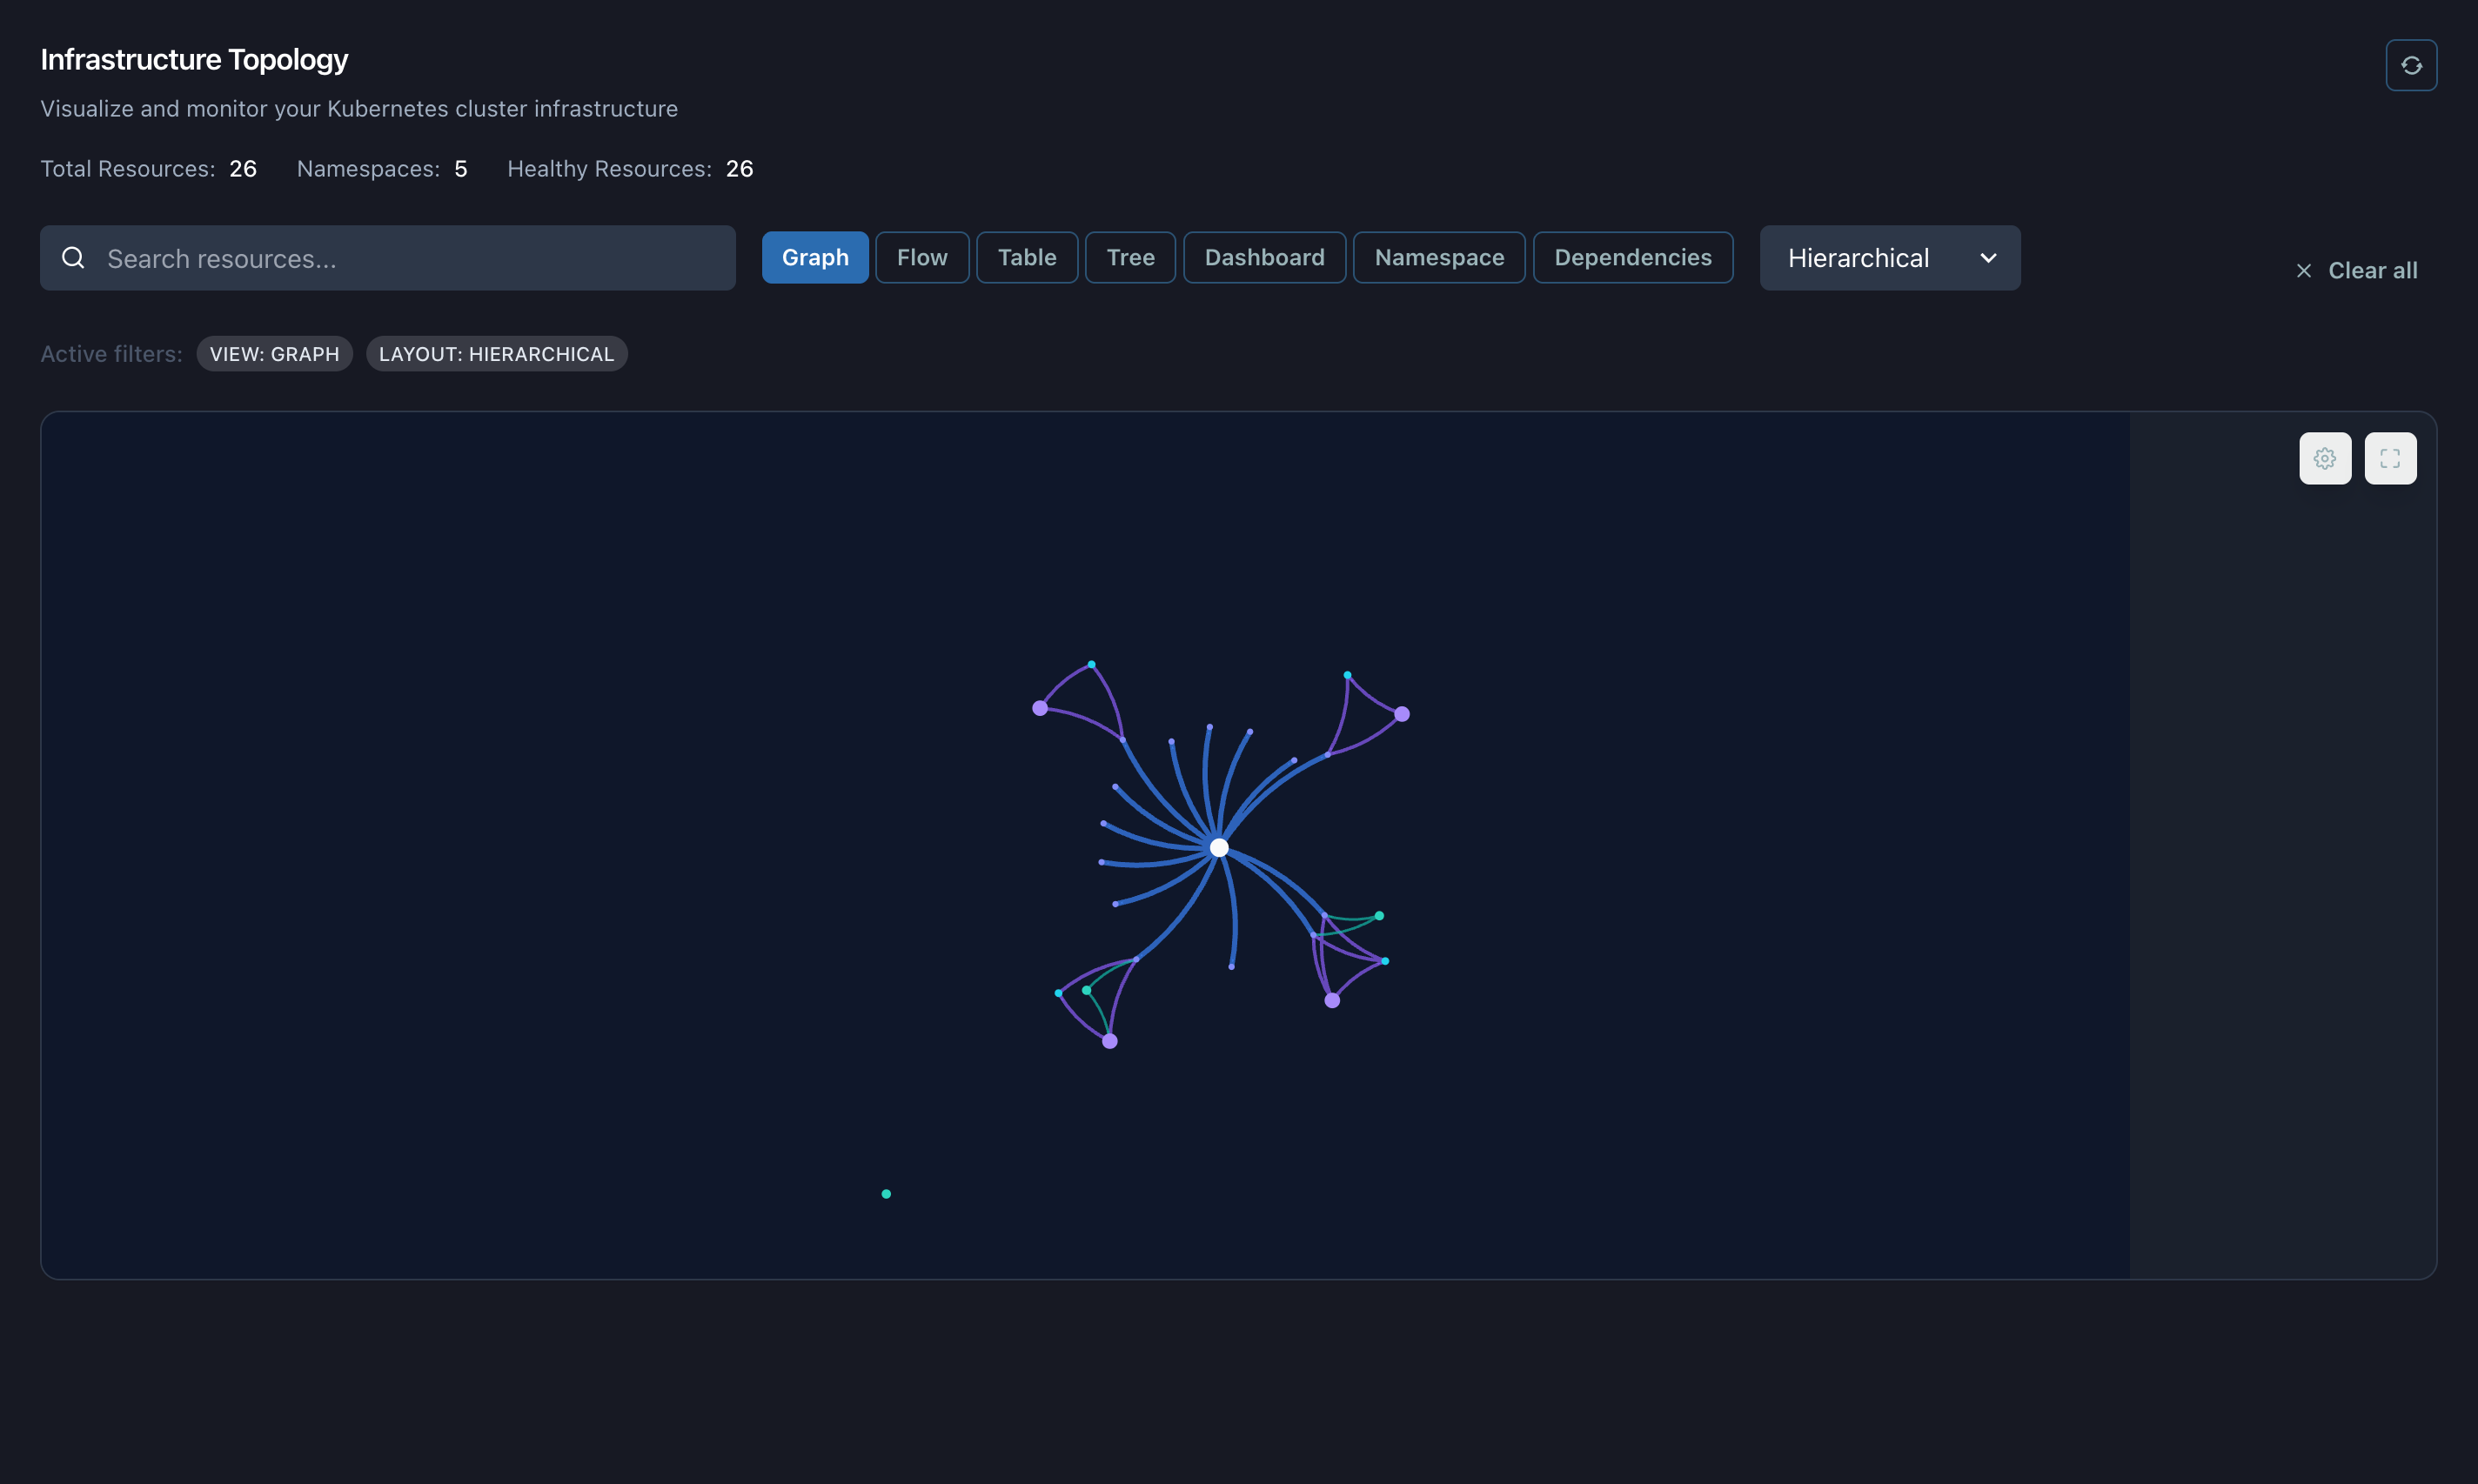 Graph view using the Hierarchical layout
### Graph Settings
Open Graph settings to tune readability and performance for large graphs.
Graph view using the Hierarchical layout
### Graph Settings
Open Graph settings to tune readability and performance for large graphs.
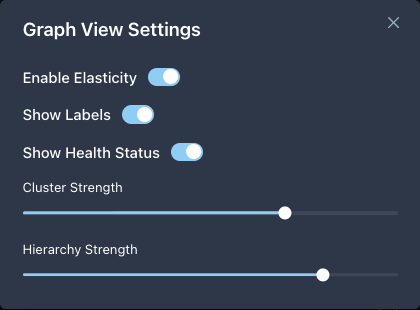 Graph View Settings: elasticity, labels, health status, and layout strengths
### Layouts
Switch layouts to highlight different structural perspectives.
Graph View Settings: elasticity, labels, health status, and layout strengths
### Layouts
Switch layouts to highlight different structural perspectives.
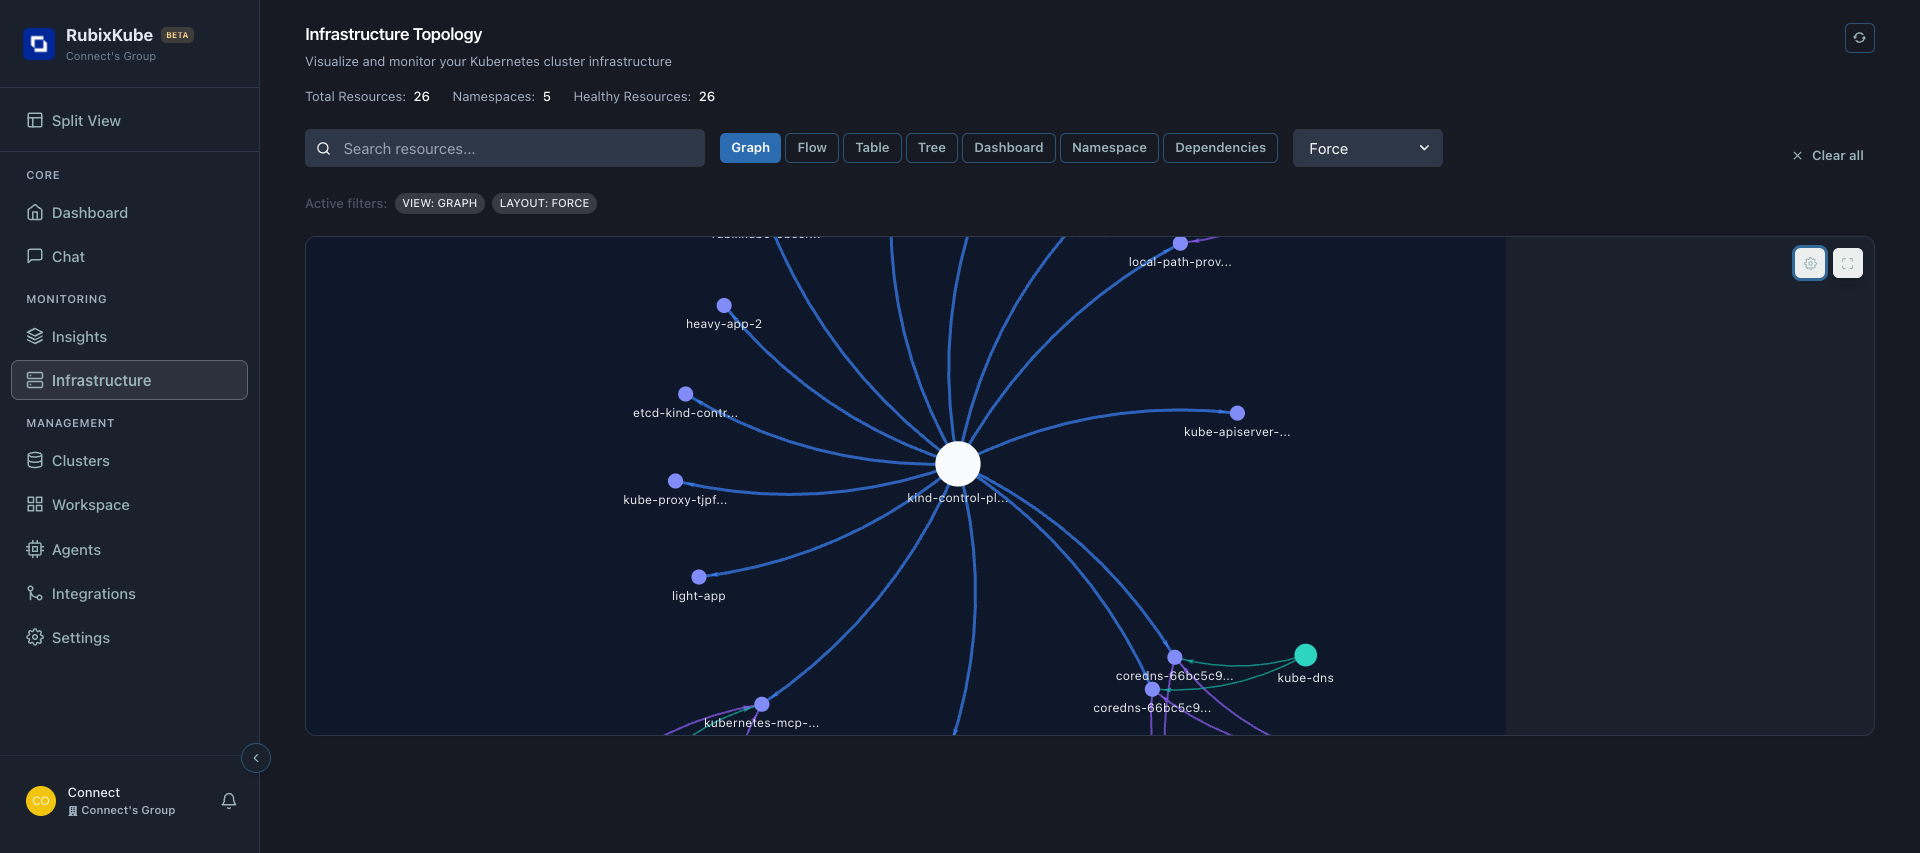 Graph view using the Force layout
***
## Table View
Table view provides a sortable, scannable inventory with per-row actions.
Graph view using the Force layout
***
## Table View
Table view provides a sortable, scannable inventory with per-row actions.
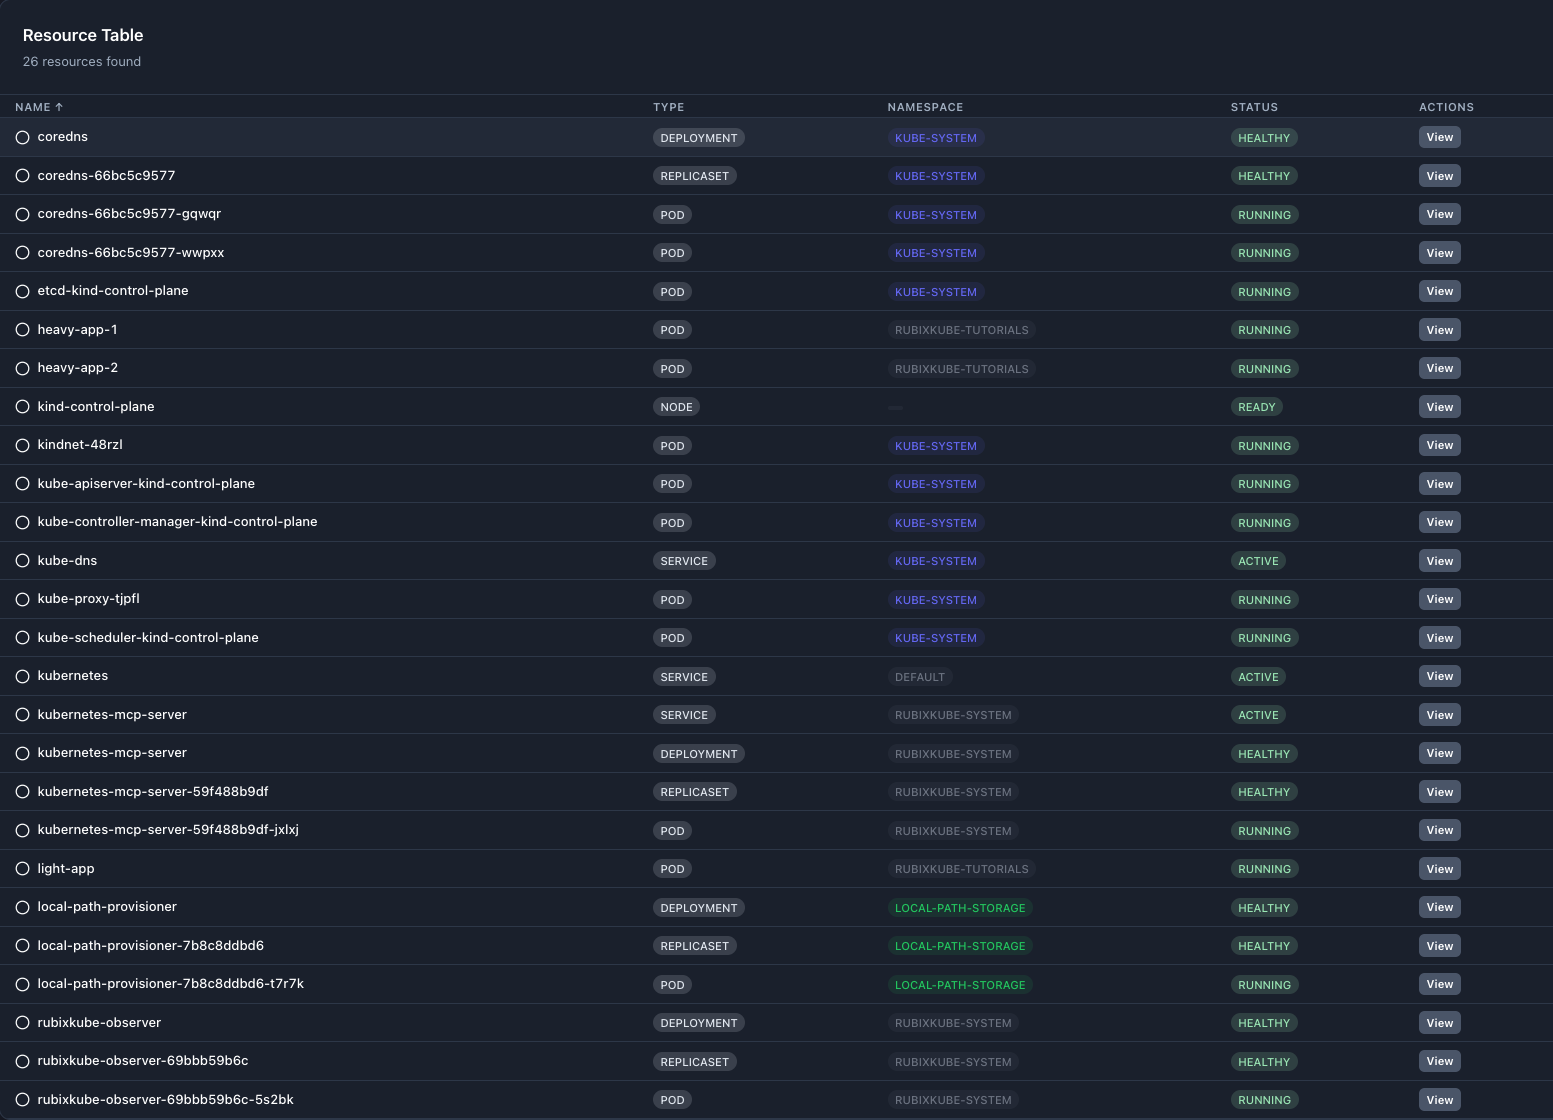 Resource Table with Name, Type, Namespace, Status, and Actions
### Searching and Filtering
Use the search input to narrow to a namespace, type, or resource name.
Resource Table with Name, Type, Namespace, Status, and Actions
### Searching and Filtering
Use the search input to narrow to a namespace, type, or resource name.
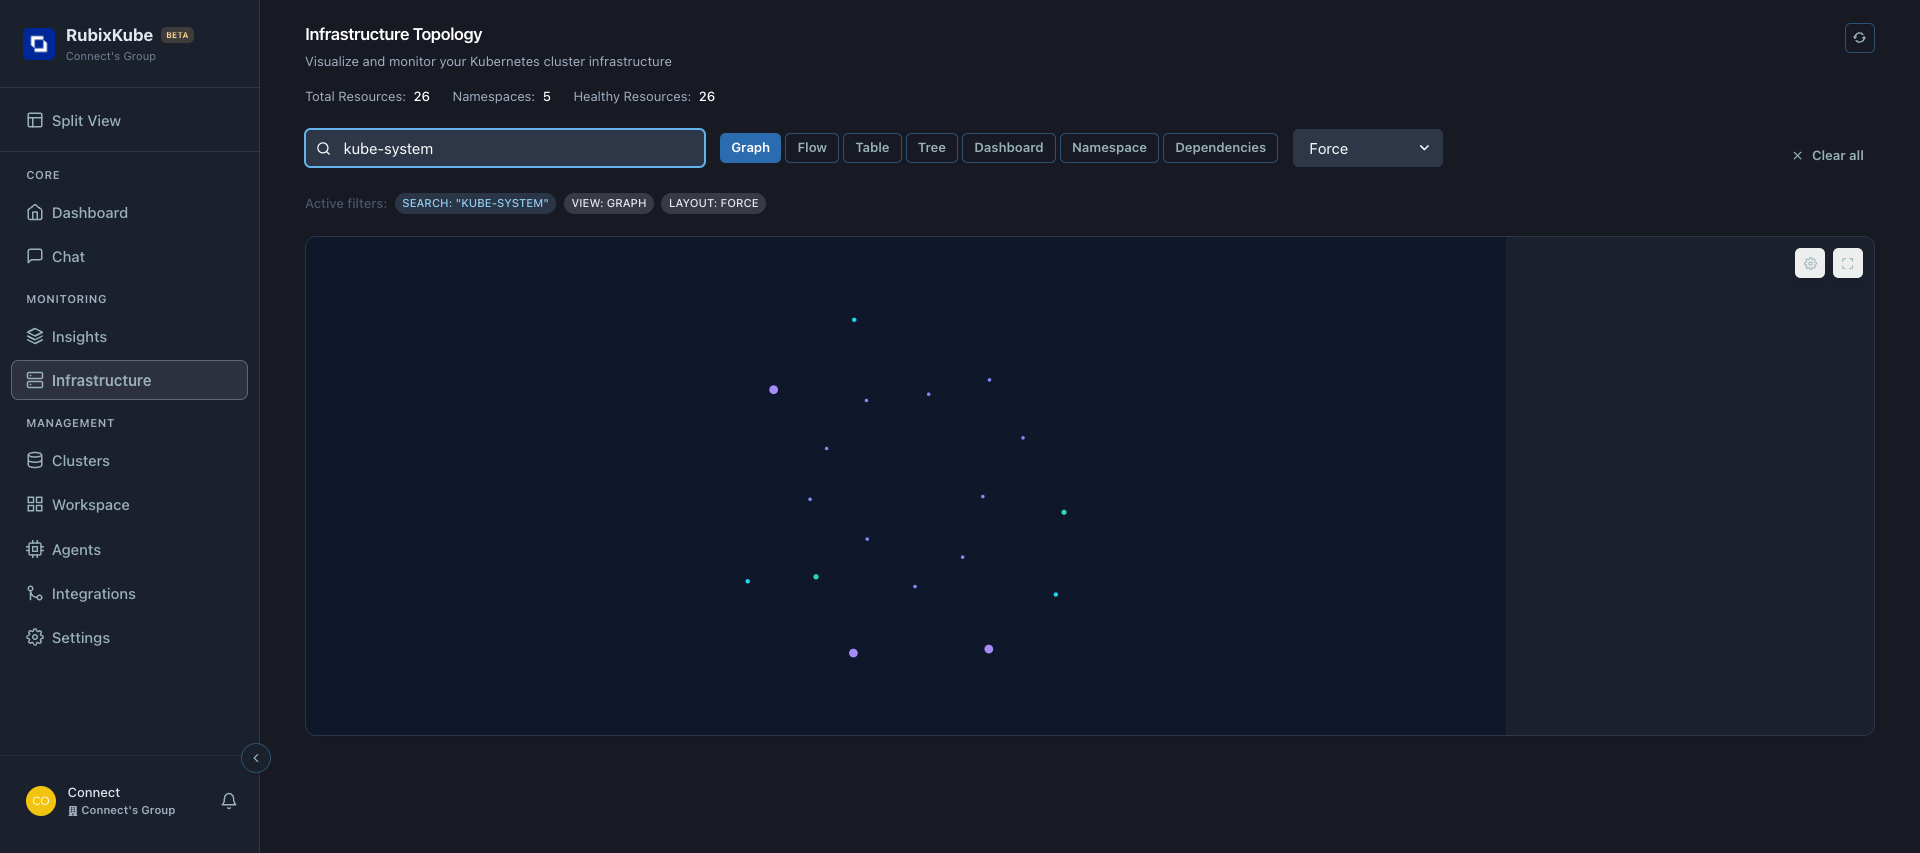 Search narrowed to the kube-system namespace
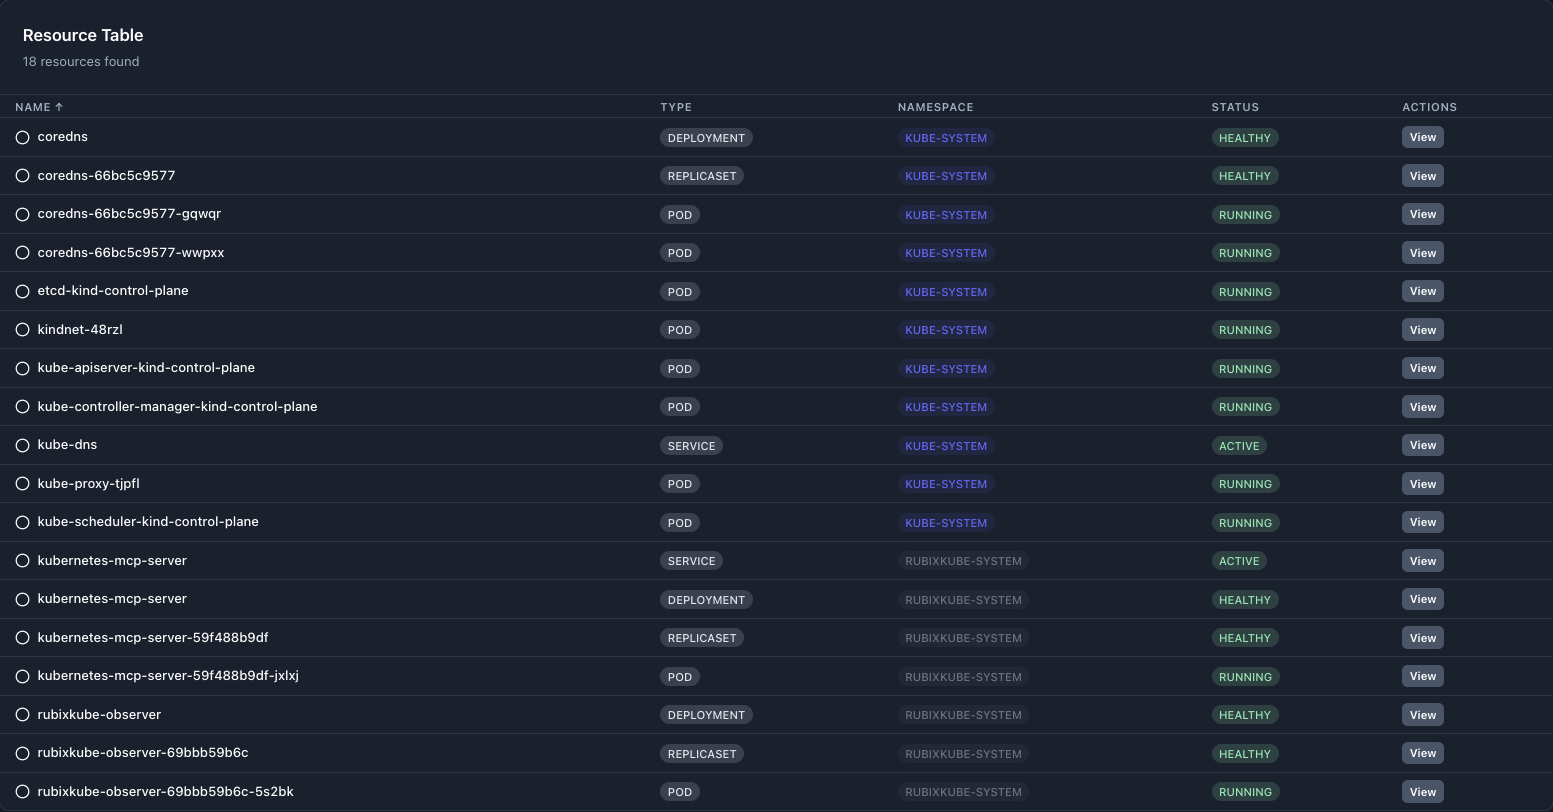 Filtered table showing only kube-system and rubixkube-system resources
***
## Resource Types
| Type | Description | Example |
| ---------- | --------------------------------------------- | ------------------ |
| Node | Kubernetes worker/control-plane node | kind-control-plane |
| Pod | Smallest deployable unit, containers grouped | coredns-66bc... |
| Deployment | Declarative set of Pods with rollout strategy | rubixkube-observer |
| ReplicaSet | Maintains a stable set of replica Pods | ...-59f488b9df |
| Service | Stable virtual IP exposing a set of Pods | kube-dns |
***
## Common Workflows
### Investigate a service outage
1. Go to Graph view and select the Service.
2. Inspect connected Pods for degraded or failing status.
3. Switch to Table view and filter by the service's namespace to see related Deployments, ReplicaSets, and Pods.
### Validate a deployment
1. After a rollout, click Refresh.
2. In Table view, sort by Type and verify Deployment, ReplicaSet, and new Pods.
3. In Graph view, confirm edges from Service to the new Pods.
### Namespace health review
1. Filter by the target namespace.
2. Check Summary metrics and Table status column.
3. Use Graph settings to enable labels and health for quick scanning.
***
## Tips
* Prefer Hierarchical layout for large clusters; switch to Force for cluster adjacency insights.
* Hide labels for very dense graphs to improve render performance, then toggle them on when zoomed in.
* Use Clear all to quickly reset complex filter states.
***
## Next
* Continue to [Using Agents](/using/agents)
***
## Related Guides
* [Dashboard](/using/dashboard)
* [Insights](/using/insights)
* [Clusters](/using/clusters)
* [Workspace](/using/workspace)
* [Settings](/using/settings)
* [Integrations](/using/integrations)
***
## Need Help?
Email: [connect@rubixkube.ai](mailto:connect@rubixkube.ai)
Filtered table showing only kube-system and rubixkube-system resources
***
## Resource Types
| Type | Description | Example |
| ---------- | --------------------------------------------- | ------------------ |
| Node | Kubernetes worker/control-plane node | kind-control-plane |
| Pod | Smallest deployable unit, containers grouped | coredns-66bc... |
| Deployment | Declarative set of Pods with rollout strategy | rubixkube-observer |
| ReplicaSet | Maintains a stable set of replica Pods | ...-59f488b9df |
| Service | Stable virtual IP exposing a set of Pods | kube-dns |
***
## Common Workflows
### Investigate a service outage
1. Go to Graph view and select the Service.
2. Inspect connected Pods for degraded or failing status.
3. Switch to Table view and filter by the service's namespace to see related Deployments, ReplicaSets, and Pods.
### Validate a deployment
1. After a rollout, click Refresh.
2. In Table view, sort by Type and verify Deployment, ReplicaSet, and new Pods.
3. In Graph view, confirm edges from Service to the new Pods.
### Namespace health review
1. Filter by the target namespace.
2. Check Summary metrics and Table status column.
3. Use Graph settings to enable labels and health for quick scanning.
***
## Tips
* Prefer Hierarchical layout for large clusters; switch to Force for cluster adjacency insights.
* Hide labels for very dense graphs to improve render performance, then toggle them on when zoomed in.
* Use Clear all to quickly reset complex filter states.
***
## Next
* Continue to [Using Agents](/using/agents)
***
## Related Guides
* [Dashboard](/using/dashboard)
* [Insights](/using/insights)
* [Clusters](/using/clusters)
* [Workspace](/using/workspace)
* [Settings](/using/settings)
* [Integrations](/using/integrations)
***
## Need Help?
Email: [connect@rubixkube.ai](mailto:connect@rubixkube.ai)
Please include your Tenant ID (Settings → Organization), timestamp, and screenshots.
Step-by-step fixes for common issues across Dashboard, Insights, Agents, and more.
Answers to common questions about setup, RCA, agents, and docs.
Browse all guides to learn workflows and best practices.