> ## Documentation Index
> Fetch the complete documentation index at: https://docs.rubixkube.ai/llms.txt
> Use this file to discover all available pages before exploring further.
# Dashboard
> Your command centre for Site Reliability Intelligence. Health, insights, actions, RCA reports and infrastructure at a glance across every environment.
The Dashboard is where your day starts. One screen that tells you whether your infrastructure is healthy, what RubixKube is working on, and what it found while you were away. Every tile and list links through to its own page for the full story.
 ## The layout
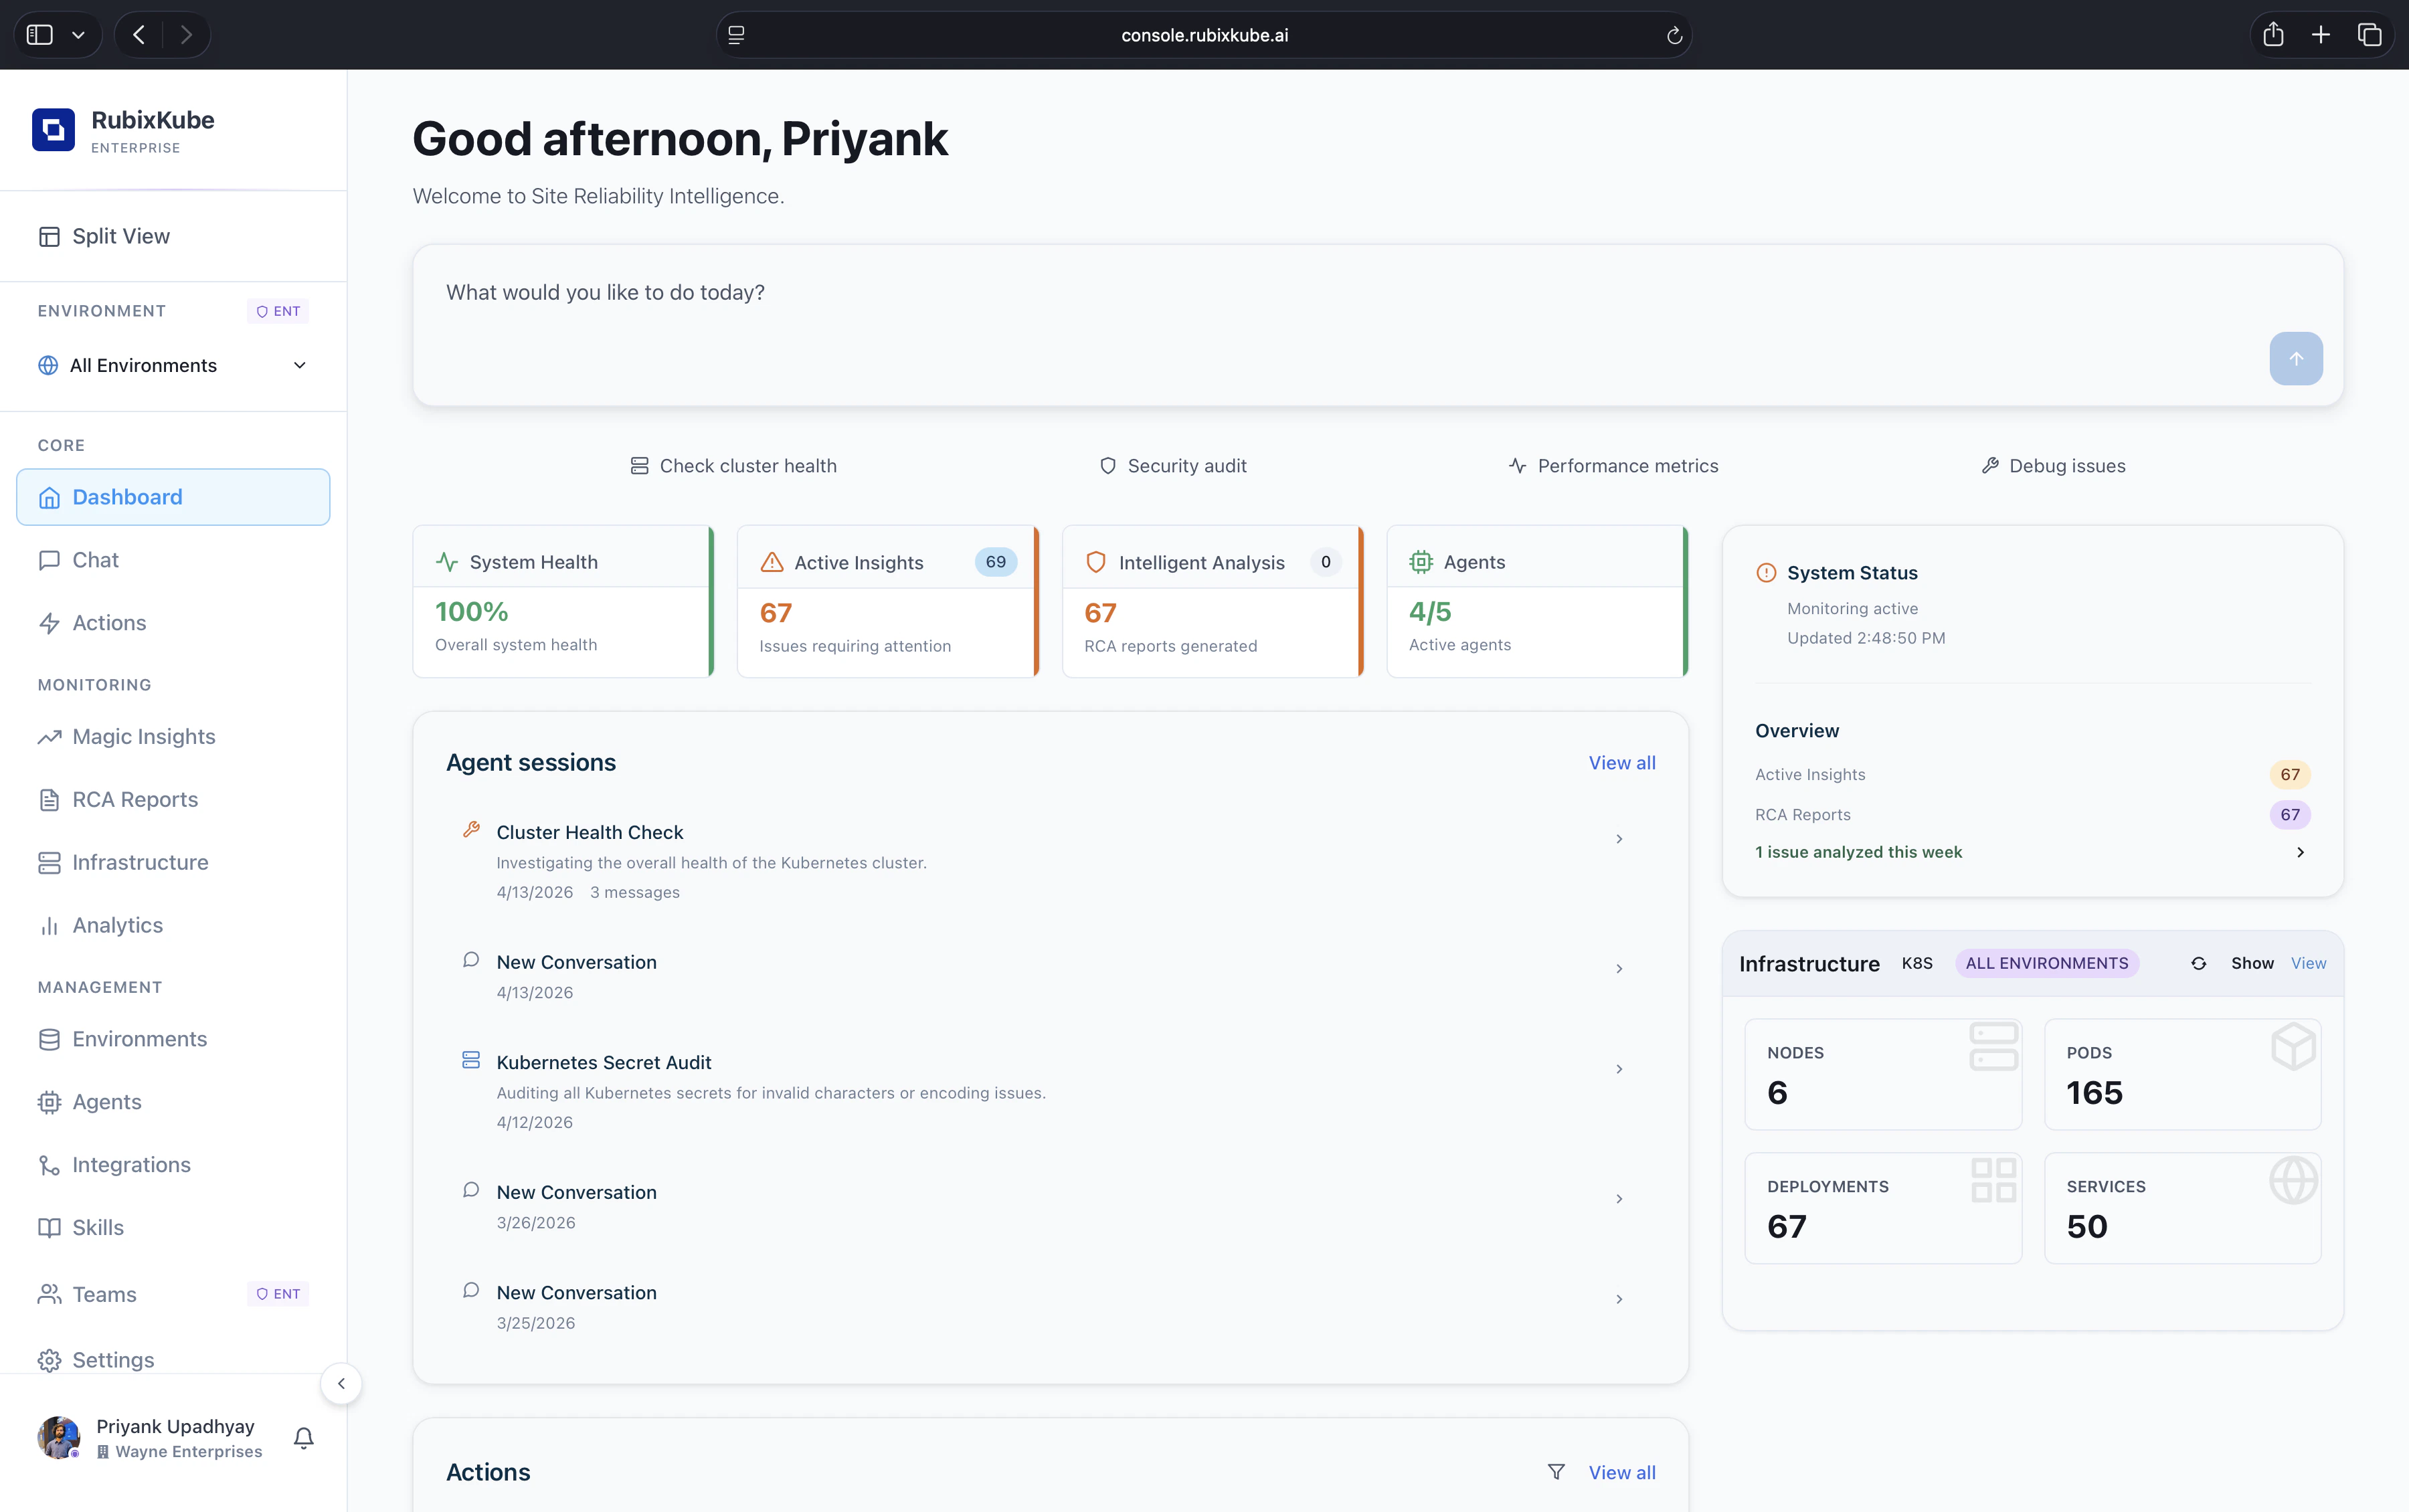
The Dashboard has three bands. The top is for starting new work. The middle and bottom are for catching up on what's already happened. The right rail carries the vitals.
* **Top band.** Greeting, a wide chat input, quick-action pills and the environment switcher.
* **Four health tiles.** A scannable summary that sits between the bands.
* **Left column.** Agent sessions, Actions, Insights and RCA reports — previews of each, with a **View all** link to the full page.
* **Right rail.** System Status with outcome KPIs, and an Infrastructure snapshot for the selected environment.
## The four health tiles
## The layout
The Dashboard has three bands. The top is for starting new work. The middle and bottom are for catching up on what's already happened. The right rail carries the vitals.
* **Top band.** Greeting, a wide chat input, quick-action pills and the environment switcher.
* **Four health tiles.** A scannable summary that sits between the bands.
* **Left column.** Agent sessions, Actions, Insights and RCA reports — previews of each, with a **View all** link to the full page.
* **Right rail.** System Status with outcome KPIs, and an Infrastructure snapshot for the selected environment.
## The four health tiles
 These sit under the quick actions and are the fastest read on the page. Each tile is clickable and deep-links into the matching section.
A single percentage for overall health across your connected environments. Reflects workload state, active incidents and agent connectivity. Click through to the affected insights when it drops.
How many issues currently need attention. Opens the [Insights](/using/insights) list, filtered to what's open.
How many RCA reports have been produced. Detection is one thing; this tile tells you analysis is done and the reports are ready to read.
Active agents over total, for example 4/5. If anything is offline, the [Agents](/using/agents) page tells you which one and why.
## Starting new work
These sit under the quick actions and are the fastest read on the page. Each tile is clickable and deep-links into the matching section.
A single percentage for overall health across your connected environments. Reflects workload state, active incidents and agent connectivity. Click through to the affected insights when it drops.
How many issues currently need attention. Opens the [Insights](/using/insights) list, filtered to what's open.
How many RCA reports have been produced. Detection is one thing; this tile tells you analysis is done and the reports are ready to read.
Active agents over total, for example 4/5. If anything is offline, the [Agents](/using/agents) page tells you which one and why.
## Starting new work
 The top band is how you kick things off.
* **Chat input.** Type a question like "what's wrong with payments?" or "what changed in production in the last hour?". Uses the same engine as the [Rubix Chat Agent](/using/rubix-chat-agent).
* **Quick actions.** Pre-written prompts for the most common checks: **Check cluster health**, **Security audit**, **Performance metrics** and **Debug issues**. Good starting points when you're new to the console.
* **Environment switcher.** Top-left. Scope the Dashboard to a single environment, or keep it on **All Environments** to see everything rolled up.
## Catching up on what's happened
The left column is a stream of previews, each capped at the most recent entries and each with its own **View all**.
### Agent sessions
The top band is how you kick things off.
* **Chat input.** Type a question like "what's wrong with payments?" or "what changed in production in the last hour?". Uses the same engine as the [Rubix Chat Agent](/using/rubix-chat-agent).
* **Quick actions.** Pre-written prompts for the most common checks: **Check cluster health**, **Security audit**, **Performance metrics** and **Debug issues**. Good starting points when you're new to the console.
* **Environment switcher.** Top-left. Scope the Dashboard to a single environment, or keep it on **All Environments** to see everything rolled up.
## Catching up on what's happened
The left column is a stream of previews, each capped at the most recent entries and each with its own **View all**.
### Agent sessions
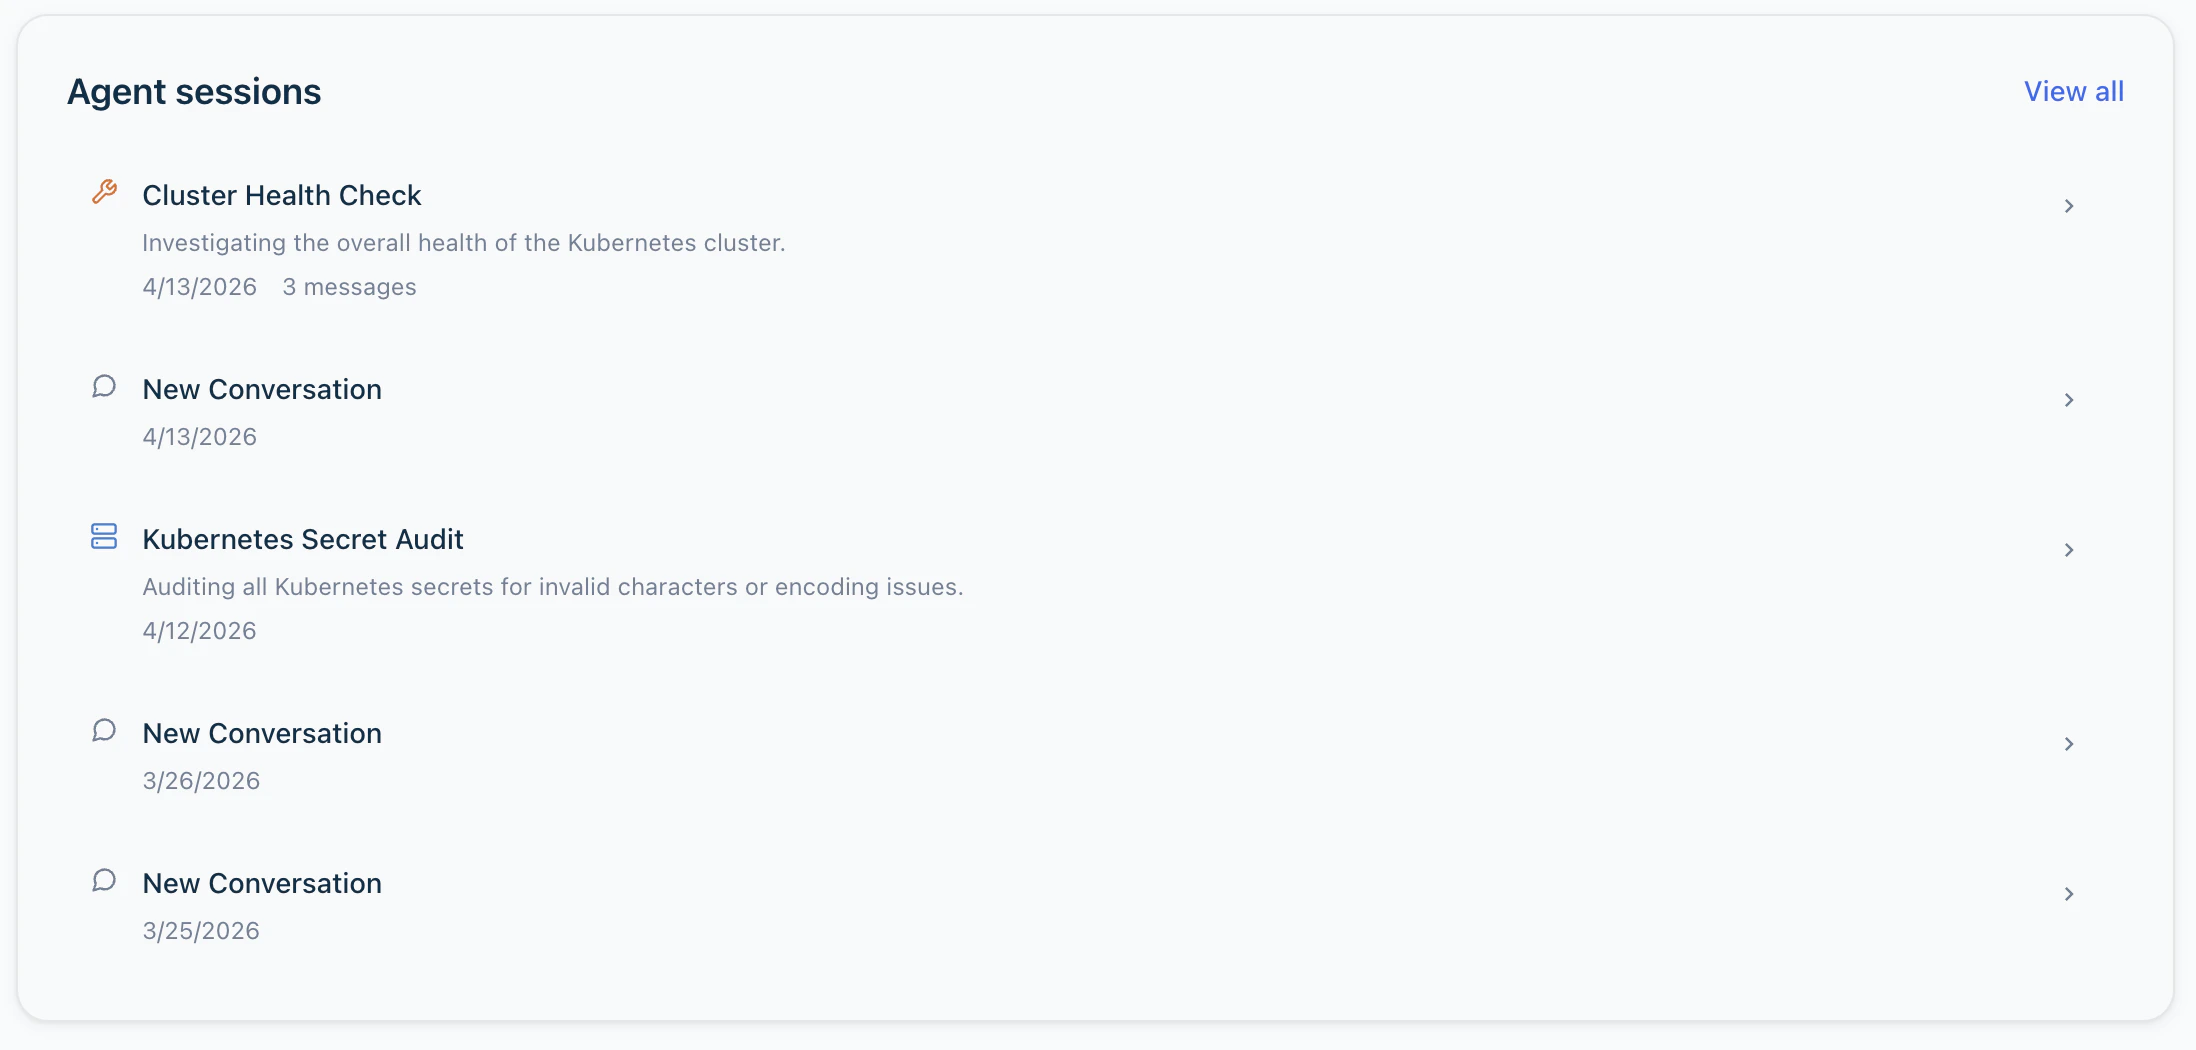 Recent chat conversations across the team, with titles, dates and message counts. Click a row to rejoin the conversation. **View all** opens the full chat history.
### Actions, Insights and RCA reports
* **Actions.** Concrete work items RubixKube has proposed, each tagged with severity (**HIGH / MEDIUM / LOW**) and status (**ASSIGNED / TODO**). The "what do we actually do about this?" follow-ups from insights and RCA reports. Full workflow on the [Actions](/using/action) page.
* **Insights.** Issues the Observer has detected, with the number of suggestions attached to each one. Ordered newest first. Full list on the [Insights](/using/insights) page.
* **RCA reports.** The latest root-cause analyses, each summarised to a short preview. Click a row to read the full postmortem on the [RCA Reports](/using/rca-reports) page.
## The vitals on the right
The right rail answers two questions: *are we doing a good job?* and *what does the footprint look like right now?*
### System Status
Recent chat conversations across the team, with titles, dates and message counts. Click a row to rejoin the conversation. **View all** opens the full chat history.
### Actions, Insights and RCA reports
* **Actions.** Concrete work items RubixKube has proposed, each tagged with severity (**HIGH / MEDIUM / LOW**) and status (**ASSIGNED / TODO**). The "what do we actually do about this?" follow-ups from insights and RCA reports. Full workflow on the [Actions](/using/action) page.
* **Insights.** Issues the Observer has detected, with the number of suggestions attached to each one. Ordered newest first. Full list on the [Insights](/using/insights) page.
* **RCA reports.** The latest root-cause analyses, each summarised to a short preview. Click a row to read the full postmortem on the [RCA Reports](/using/rca-reports) page.
## The vitals on the right
The right rail answers two questions: *are we doing a good job?* and *what does the footprint look like right now?*
### System Status
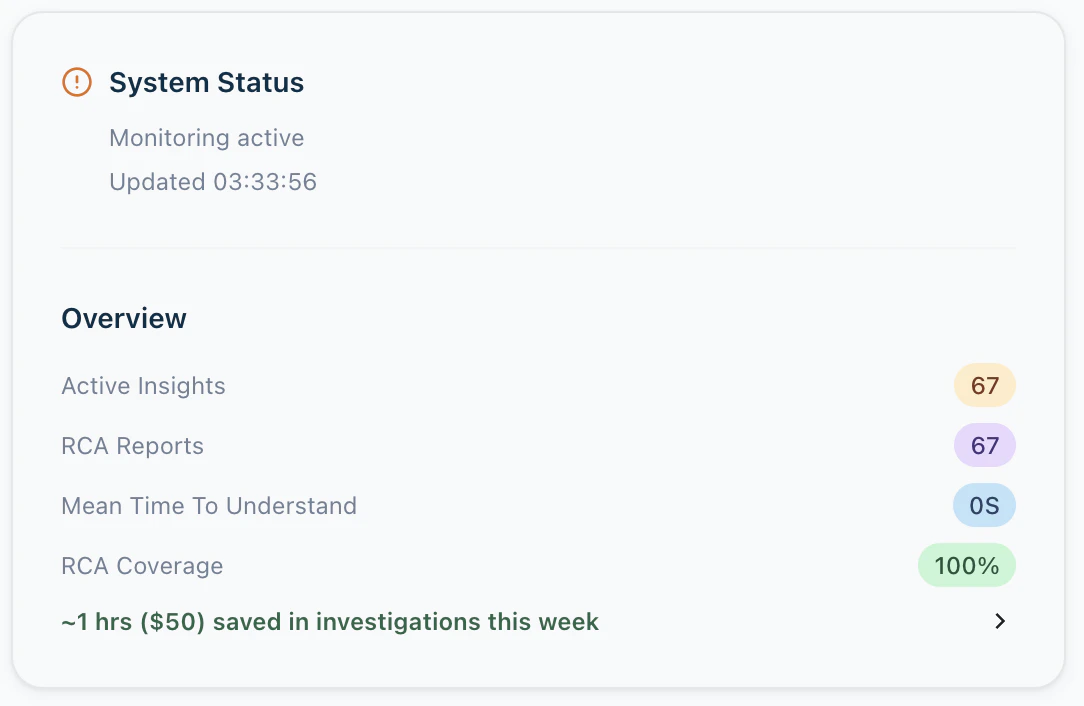 A quick read of RubixKube's own performance on your stack:
* **Active Insights.** How many issues are open.
* **RCA Reports.** How many analyses have been produced.
* **Mean Time To Understand (MTTU).** How quickly RubixKube goes from symptom to cause.
* **RCA Coverage.** The share of incidents with a completed RCA.
* **Value delivered.** A rolling estimate of investigation time and cost saved, for example "\~1 hr (\$50) saved this week".
The deep version of these numbers lives on the [Analytics](/using/analytics) page.
### Infrastructure
A quick read of RubixKube's own performance on your stack:
* **Active Insights.** How many issues are open.
* **RCA Reports.** How many analyses have been produced.
* **Mean Time To Understand (MTTU).** How quickly RubixKube goes from symptom to cause.
* **RCA Coverage.** The share of incidents with a completed RCA.
* **Value delivered.** A rolling estimate of investigation time and cost saved, for example "\~1 hr (\$50) saved this week".
The deep version of these numbers lives on the [Analytics](/using/analytics) page.
### Infrastructure
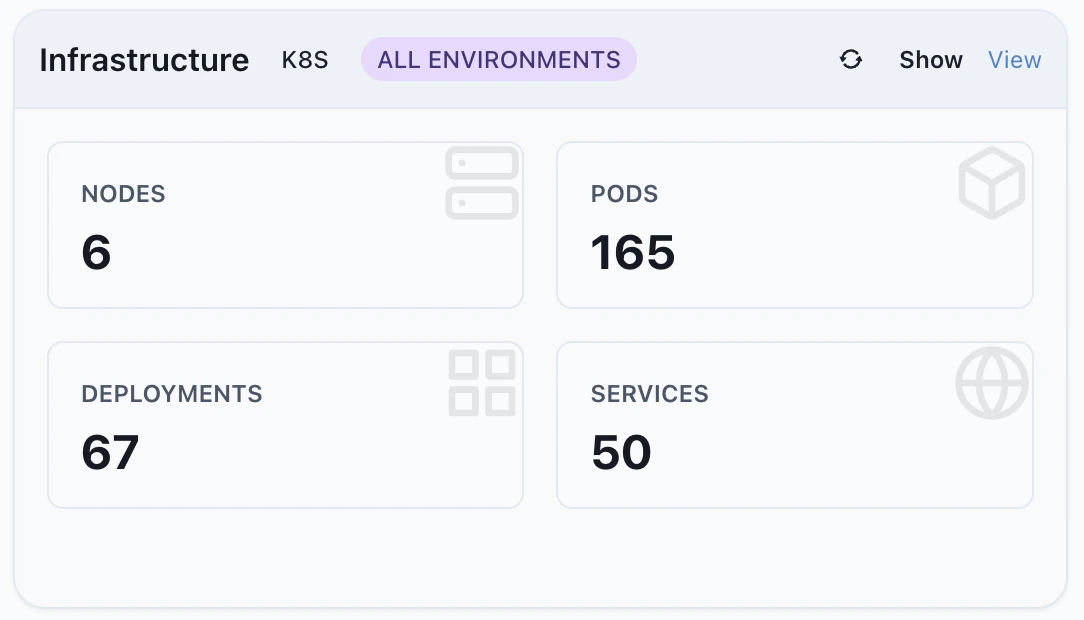 A compact count of what's connected: **Nodes**, **Pods**, **Deployments**, **Services**. The tabs at the top let you flip between a single environment (for example **K8S**) and **All Environments**. **View** opens the full [Infrastructure](/using/infrastructure) topology; **Show** expands the panel in place with extra counts like namespaces and deployed agents.
## A typical minute on the Dashboard
System Health, Active Insights, Intelligent Analysis, Agents. If everything is where you expect, you're done in ten seconds.
Anything new since you last checked in? Click in for details. The Insight and its matching RCA are usually seconds apart.
Triage the **Actions** list. Close what's done, assign what isn't, bump severity if needed.
No alarms and no new work? Close the tab and get on with your day.
## Common questions
Health reflects the state of your core infrastructure, not every issue. A handful of open insights in non-critical workloads can sit comfortably alongside a 100% score. If core workloads or agents go unhealthy, the percentage drops and the tile changes colour.
**Insights** are things RubixKube has noticed. **RCA reports** are the analyses it produces for insights that deserve a deep look. **Actions** are the concrete, assignable work items that come out of both, so a human or automation can close the loop.
Yes. The Dashboard streams updates in the background, so new insights and RCA reports appear without you hitting reload. The **Refresh** button on Infrastructure is there for when you want to force an immediate re-count after a change.
Yes. Use the environment switcher in the top-left. Pick a single environment to focus the whole page, or keep **All Environments** selected for a rolled-up view across Kubernetes, AWS, GCP, Azure and VMs.
## Where to go next
Turn the chat input into your main investigation tool.
Open issues, suggestions and how to resolve them.
Full postmortems with evidence and recommended fixes.
MTTU, RCA coverage and value delivered over time.
A compact count of what's connected: **Nodes**, **Pods**, **Deployments**, **Services**. The tabs at the top let you flip between a single environment (for example **K8S**) and **All Environments**. **View** opens the full [Infrastructure](/using/infrastructure) topology; **Show** expands the panel in place with extra counts like namespaces and deployed agents.
## A typical minute on the Dashboard
System Health, Active Insights, Intelligent Analysis, Agents. If everything is where you expect, you're done in ten seconds.
Anything new since you last checked in? Click in for details. The Insight and its matching RCA are usually seconds apart.
Triage the **Actions** list. Close what's done, assign what isn't, bump severity if needed.
No alarms and no new work? Close the tab and get on with your day.
## Common questions
Health reflects the state of your core infrastructure, not every issue. A handful of open insights in non-critical workloads can sit comfortably alongside a 100% score. If core workloads or agents go unhealthy, the percentage drops and the tile changes colour.
**Insights** are things RubixKube has noticed. **RCA reports** are the analyses it produces for insights that deserve a deep look. **Actions** are the concrete, assignable work items that come out of both, so a human or automation can close the loop.
Yes. The Dashboard streams updates in the background, so new insights and RCA reports appear without you hitting reload. The **Refresh** button on Infrastructure is there for when you want to force an immediate re-count after a change.
Yes. Use the environment switcher in the top-left. Pick a single environment to focus the whole page, or keep **All Environments** selected for a rolled-up view across Kubernetes, AWS, GCP, Azure and VMs.
## Where to go next
Turn the chat input into your main investigation tool.
Open issues, suggestions and how to resolve them.
Full postmortems with evidence and recommended fixes.
MTTU, RCA coverage and value delivered over time.