> ## Documentation Index
> Fetch the complete documentation index at: https://docs.rubixkube.ai/llms.txt
> Use this file to discover all available pages before exploring further.
# Reliability Intelligence
> Actionable reliability metrics for engineering leadership. Time saved, MTTU, RCA coverage, risk concentration, recurrence, and resolution velocity across every environment.
The **Analytics** page turns everything Rubix has investigated into a single view of reliability ROI. It answers the three questions leadership keeps asking: how much time did RubixKube save us, are we improving, and where is risk concentrated.
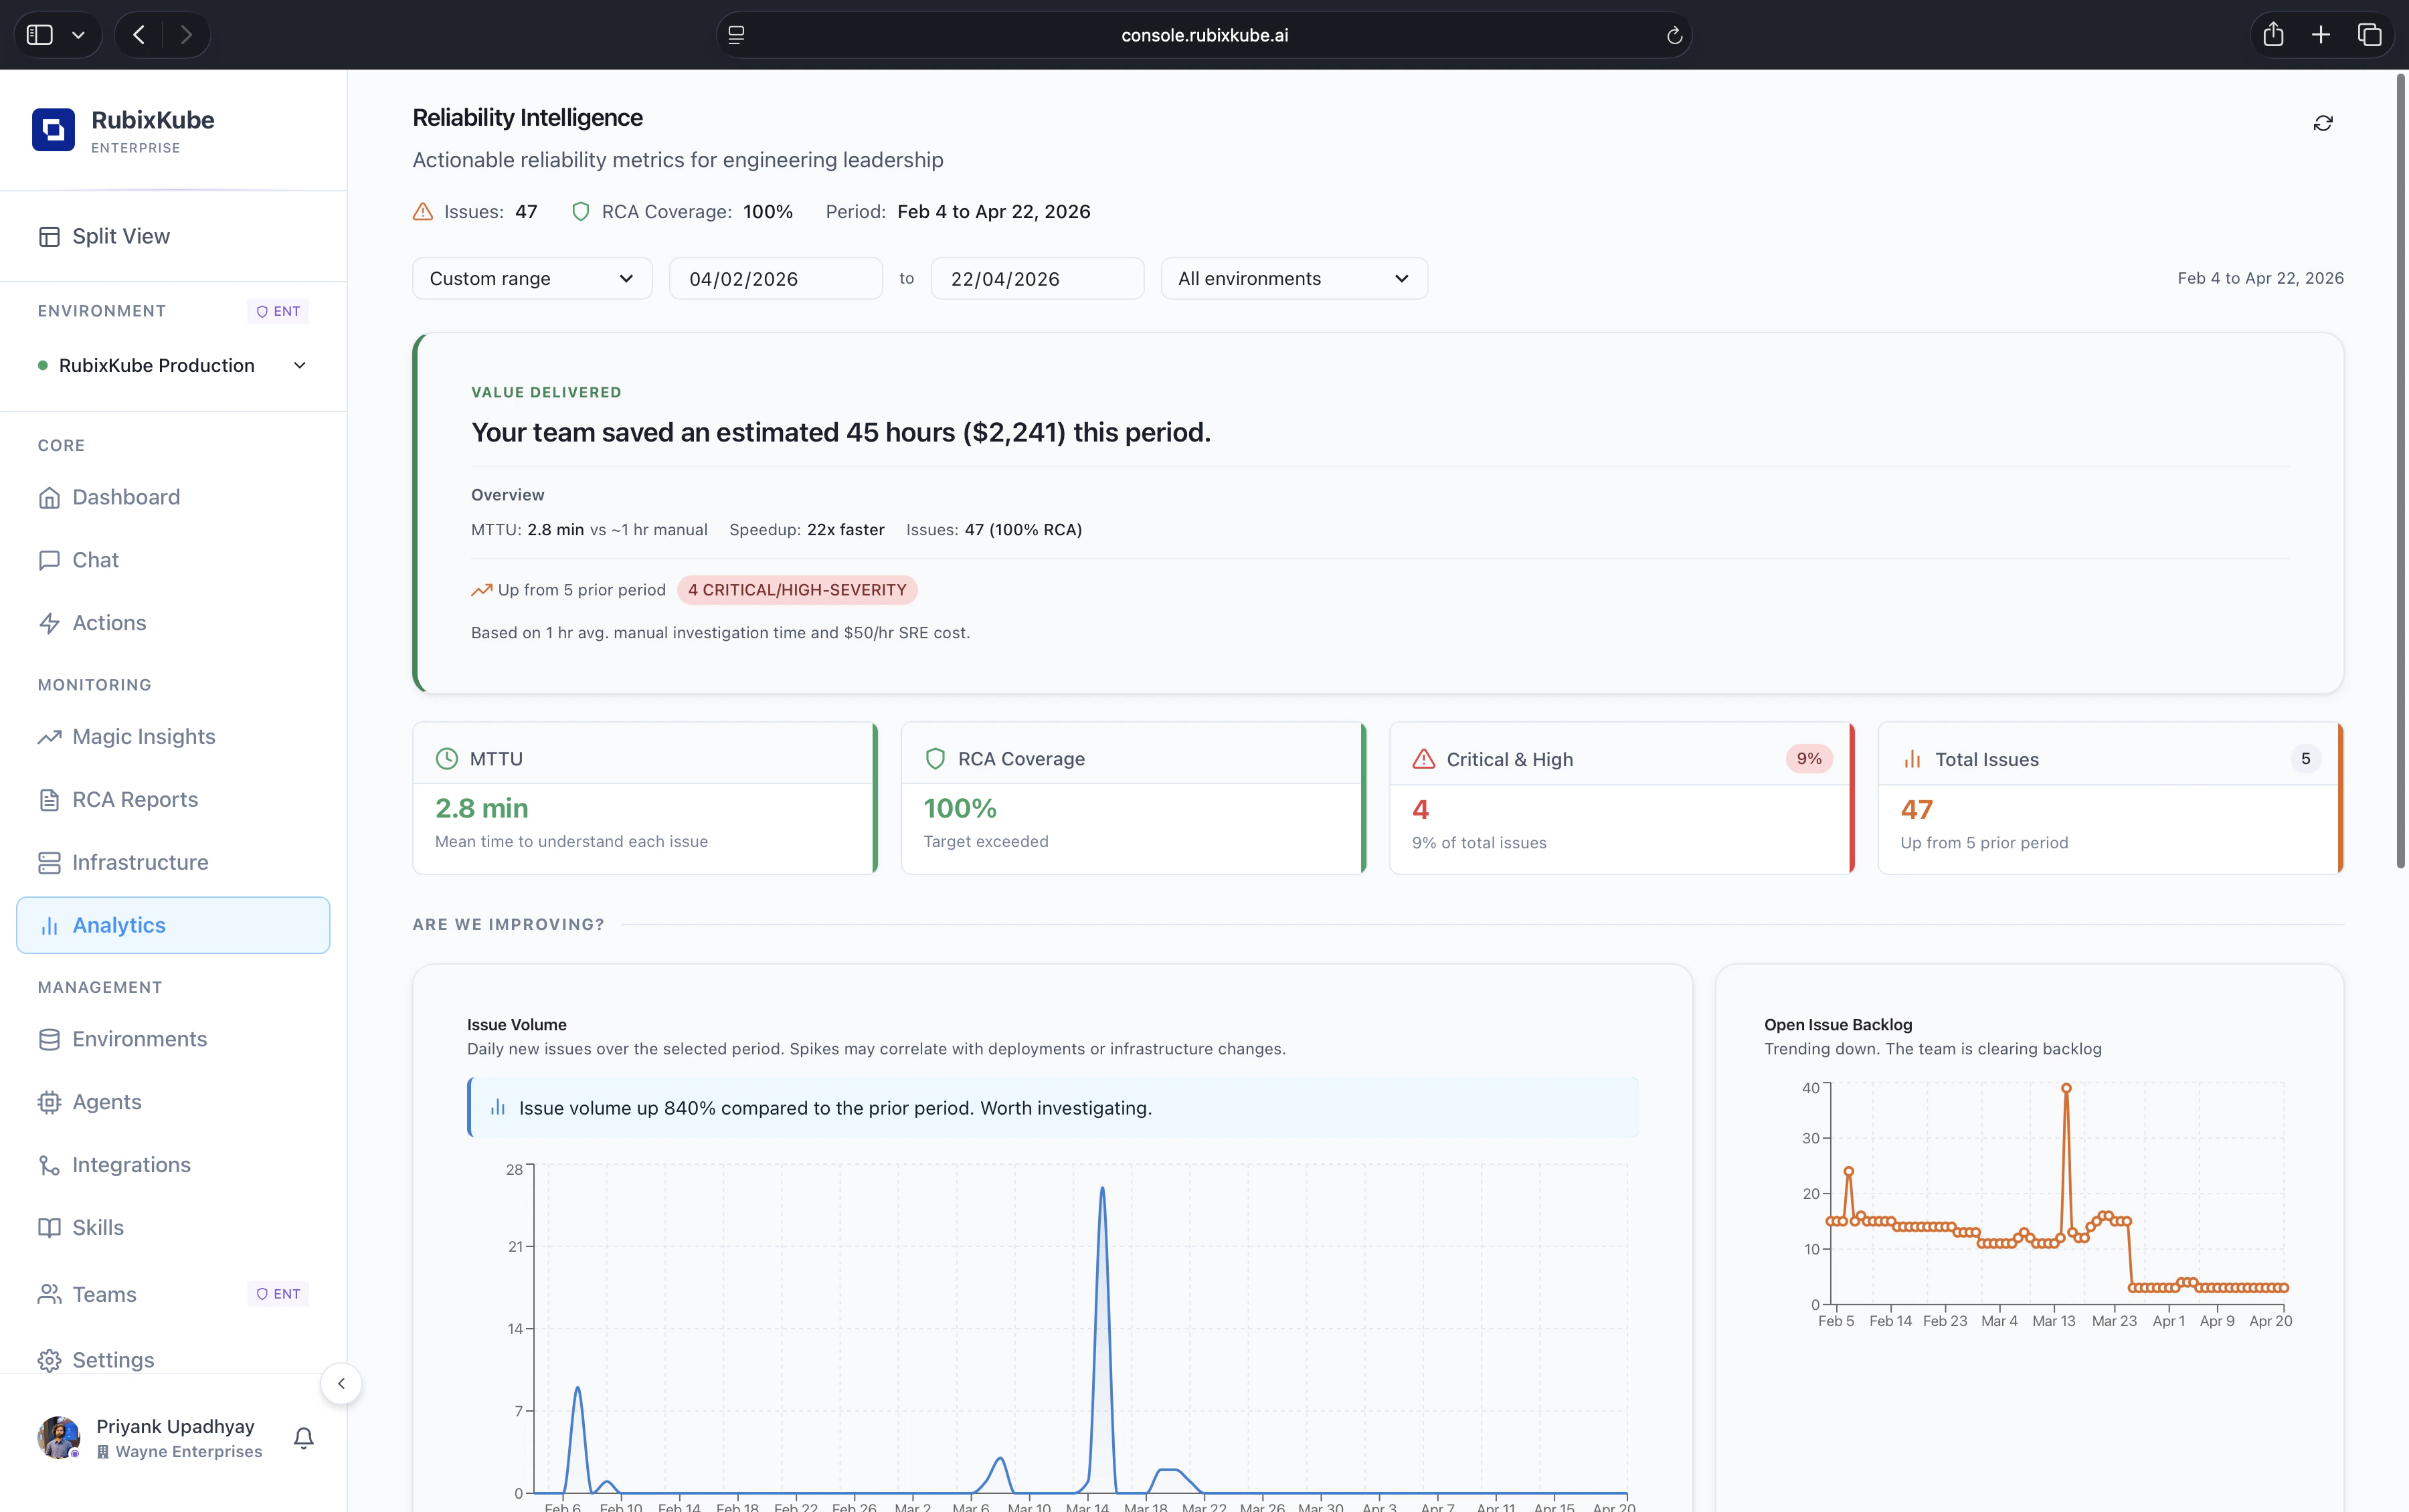 Reliability Intelligence. Top-level counters and a value-delivered card that converts MTTU savings into hours and dollars, grounded in your own investigations.
## What you see at the top
* **Value delivered.** A plain-English summary of the hours and dollars saved this period, based on your team's MTTU against a manual baseline.
* **MTTU.** Mean Time To Understand each issue, measured across every insight and RCA.
* **RCA coverage.** The share of issues that have a completed root-cause report.
* **Critical and High.** Count and share of severity for the current period.
* **Total issues.** The full count of insights opened in the selected window, with a comparison against the prior period.
## Picking a period
The header has a **date range selector**, a **custom range** picker, and an **environment selector** so you can look at one cluster, one cloud account, or everything at once. Every card on the page reflects the current selection, so you can slice the same answers by team or environment without leaving the view.
## Are we improving?
Reliability Intelligence. Top-level counters and a value-delivered card that converts MTTU savings into hours and dollars, grounded in your own investigations.
## What you see at the top
* **Value delivered.** A plain-English summary of the hours and dollars saved this period, based on your team's MTTU against a manual baseline.
* **MTTU.** Mean Time To Understand each issue, measured across every insight and RCA.
* **RCA coverage.** The share of issues that have a completed root-cause report.
* **Critical and High.** Count and share of severity for the current period.
* **Total issues.** The full count of insights opened in the selected window, with a comparison against the prior period.
## Picking a period
The header has a **date range selector**, a **custom range** picker, and an **environment selector** so you can look at one cluster, one cloud account, or everything at once. Every card on the page reflects the current selection, so you can slice the same answers by team or environment without leaving the view.
## Are we improving?
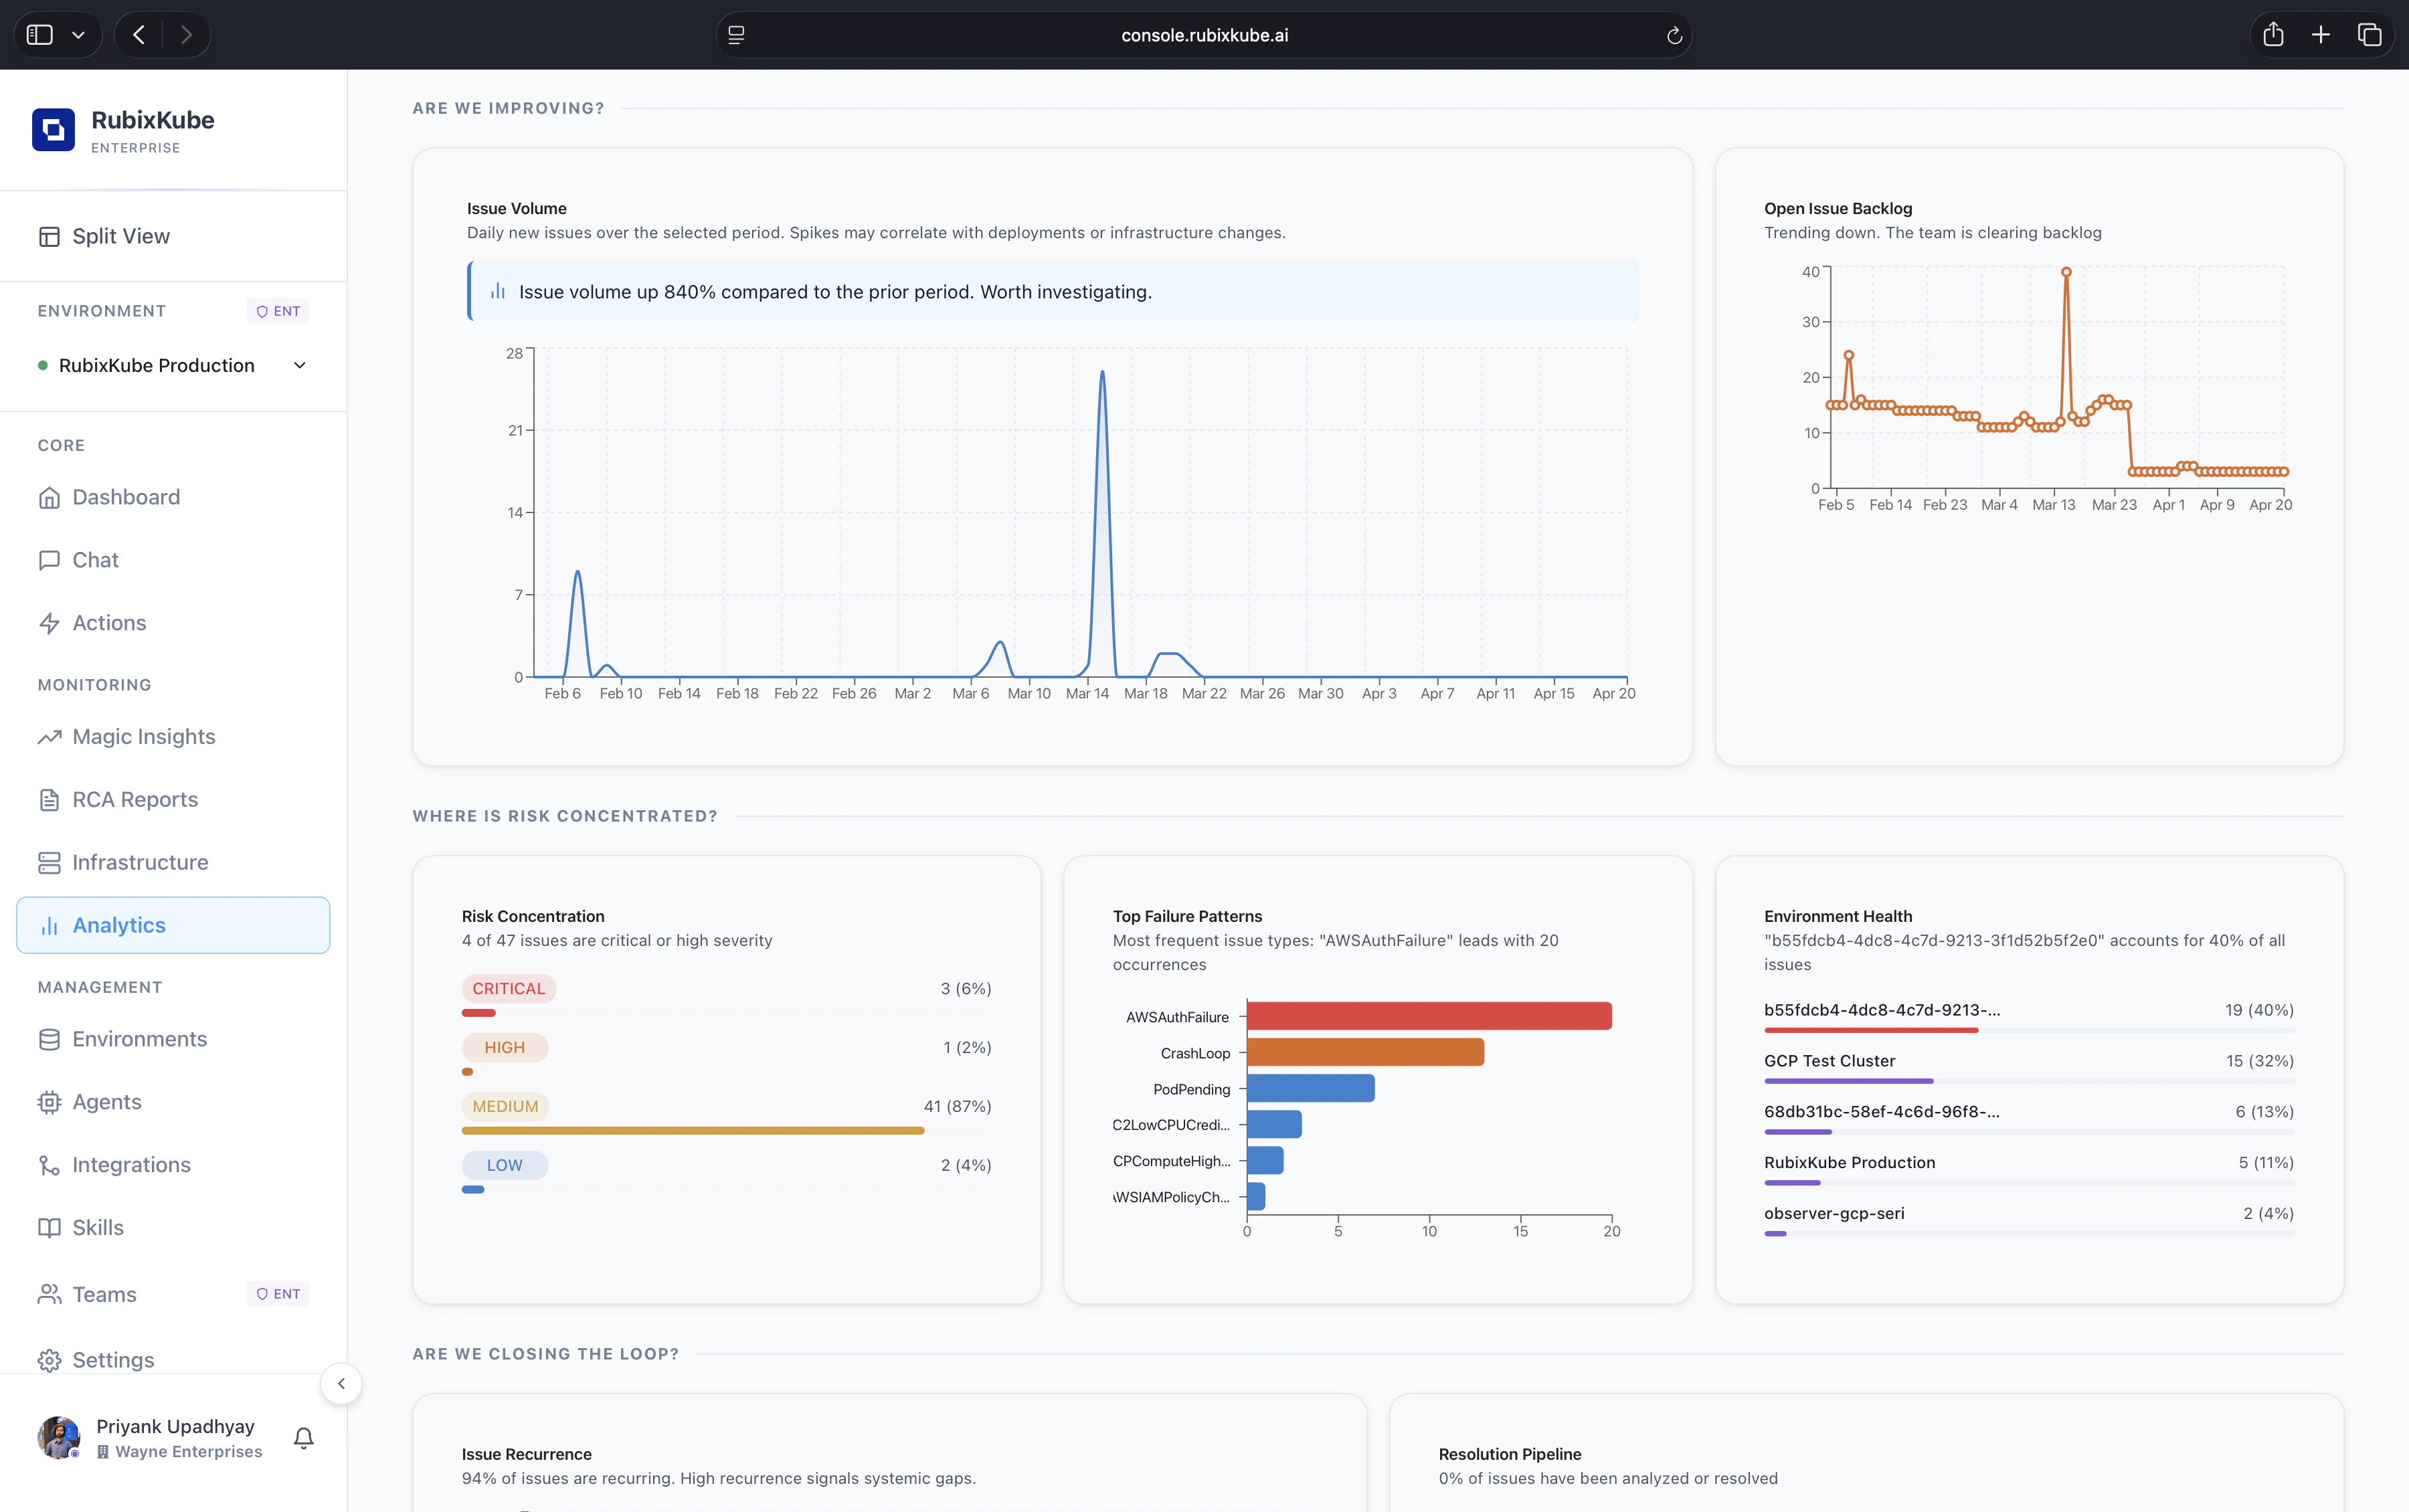 Trend panels answer two questions at once. Is the issue firehose getting bigger, and is the team keeping up with it.
Two trend panels carry most of the weight.
* **Issue Volume** plots daily new issues over the selected period. Spikes here usually line up with deployments, infrastructure changes, or external provider incidents. Callouts flag large period-over-period swings, for example "issue volume up 840% compared to the prior period".
* **Open Issue Backlog** tracks issues still open at the end of each day. A downward slope means the team is clearing faster than new issues arrive. A flat or upward slope is a signal to staff a triage shift.
## Where is risk concentrated?
Three panels sit side by side to localise the pain.
* **Risk Concentration.** Share of issues by severity for the period. Critical, High, Medium, and Low each get a count and a percentage of the total.
* **Top Failure Patterns.** A horizontal bar chart of the most frequent issue types. Things like `AWSAuthFailure`, `CrashLoop`, `PodPending`, or `C2LowCPUCredit` rise to the top. This is where platform-team attention usually pays off first.
* **Environment Health.** A ranked list of environments by share of total issues. A single environment accounting for 40% of all issues is a strong signal to inspect first.
## Are we closing the loop?
Trend panels answer two questions at once. Is the issue firehose getting bigger, and is the team keeping up with it.
Two trend panels carry most of the weight.
* **Issue Volume** plots daily new issues over the selected period. Spikes here usually line up with deployments, infrastructure changes, or external provider incidents. Callouts flag large period-over-period swings, for example "issue volume up 840% compared to the prior period".
* **Open Issue Backlog** tracks issues still open at the end of each day. A downward slope means the team is clearing faster than new issues arrive. A flat or upward slope is a signal to staff a triage shift.
## Where is risk concentrated?
Three panels sit side by side to localise the pain.
* **Risk Concentration.** Share of issues by severity for the period. Critical, High, Medium, and Low each get a count and a percentage of the total.
* **Top Failure Patterns.** A horizontal bar chart of the most frequent issue types. Things like `AWSAuthFailure`, `CrashLoop`, `PodPending`, or `C2LowCPUCredit` rise to the top. This is where platform-team attention usually pays off first.
* **Environment Health.** A ranked list of environments by share of total issues. A single environment accounting for 40% of all issues is a strong signal to inspect first.
## Are we closing the loop?
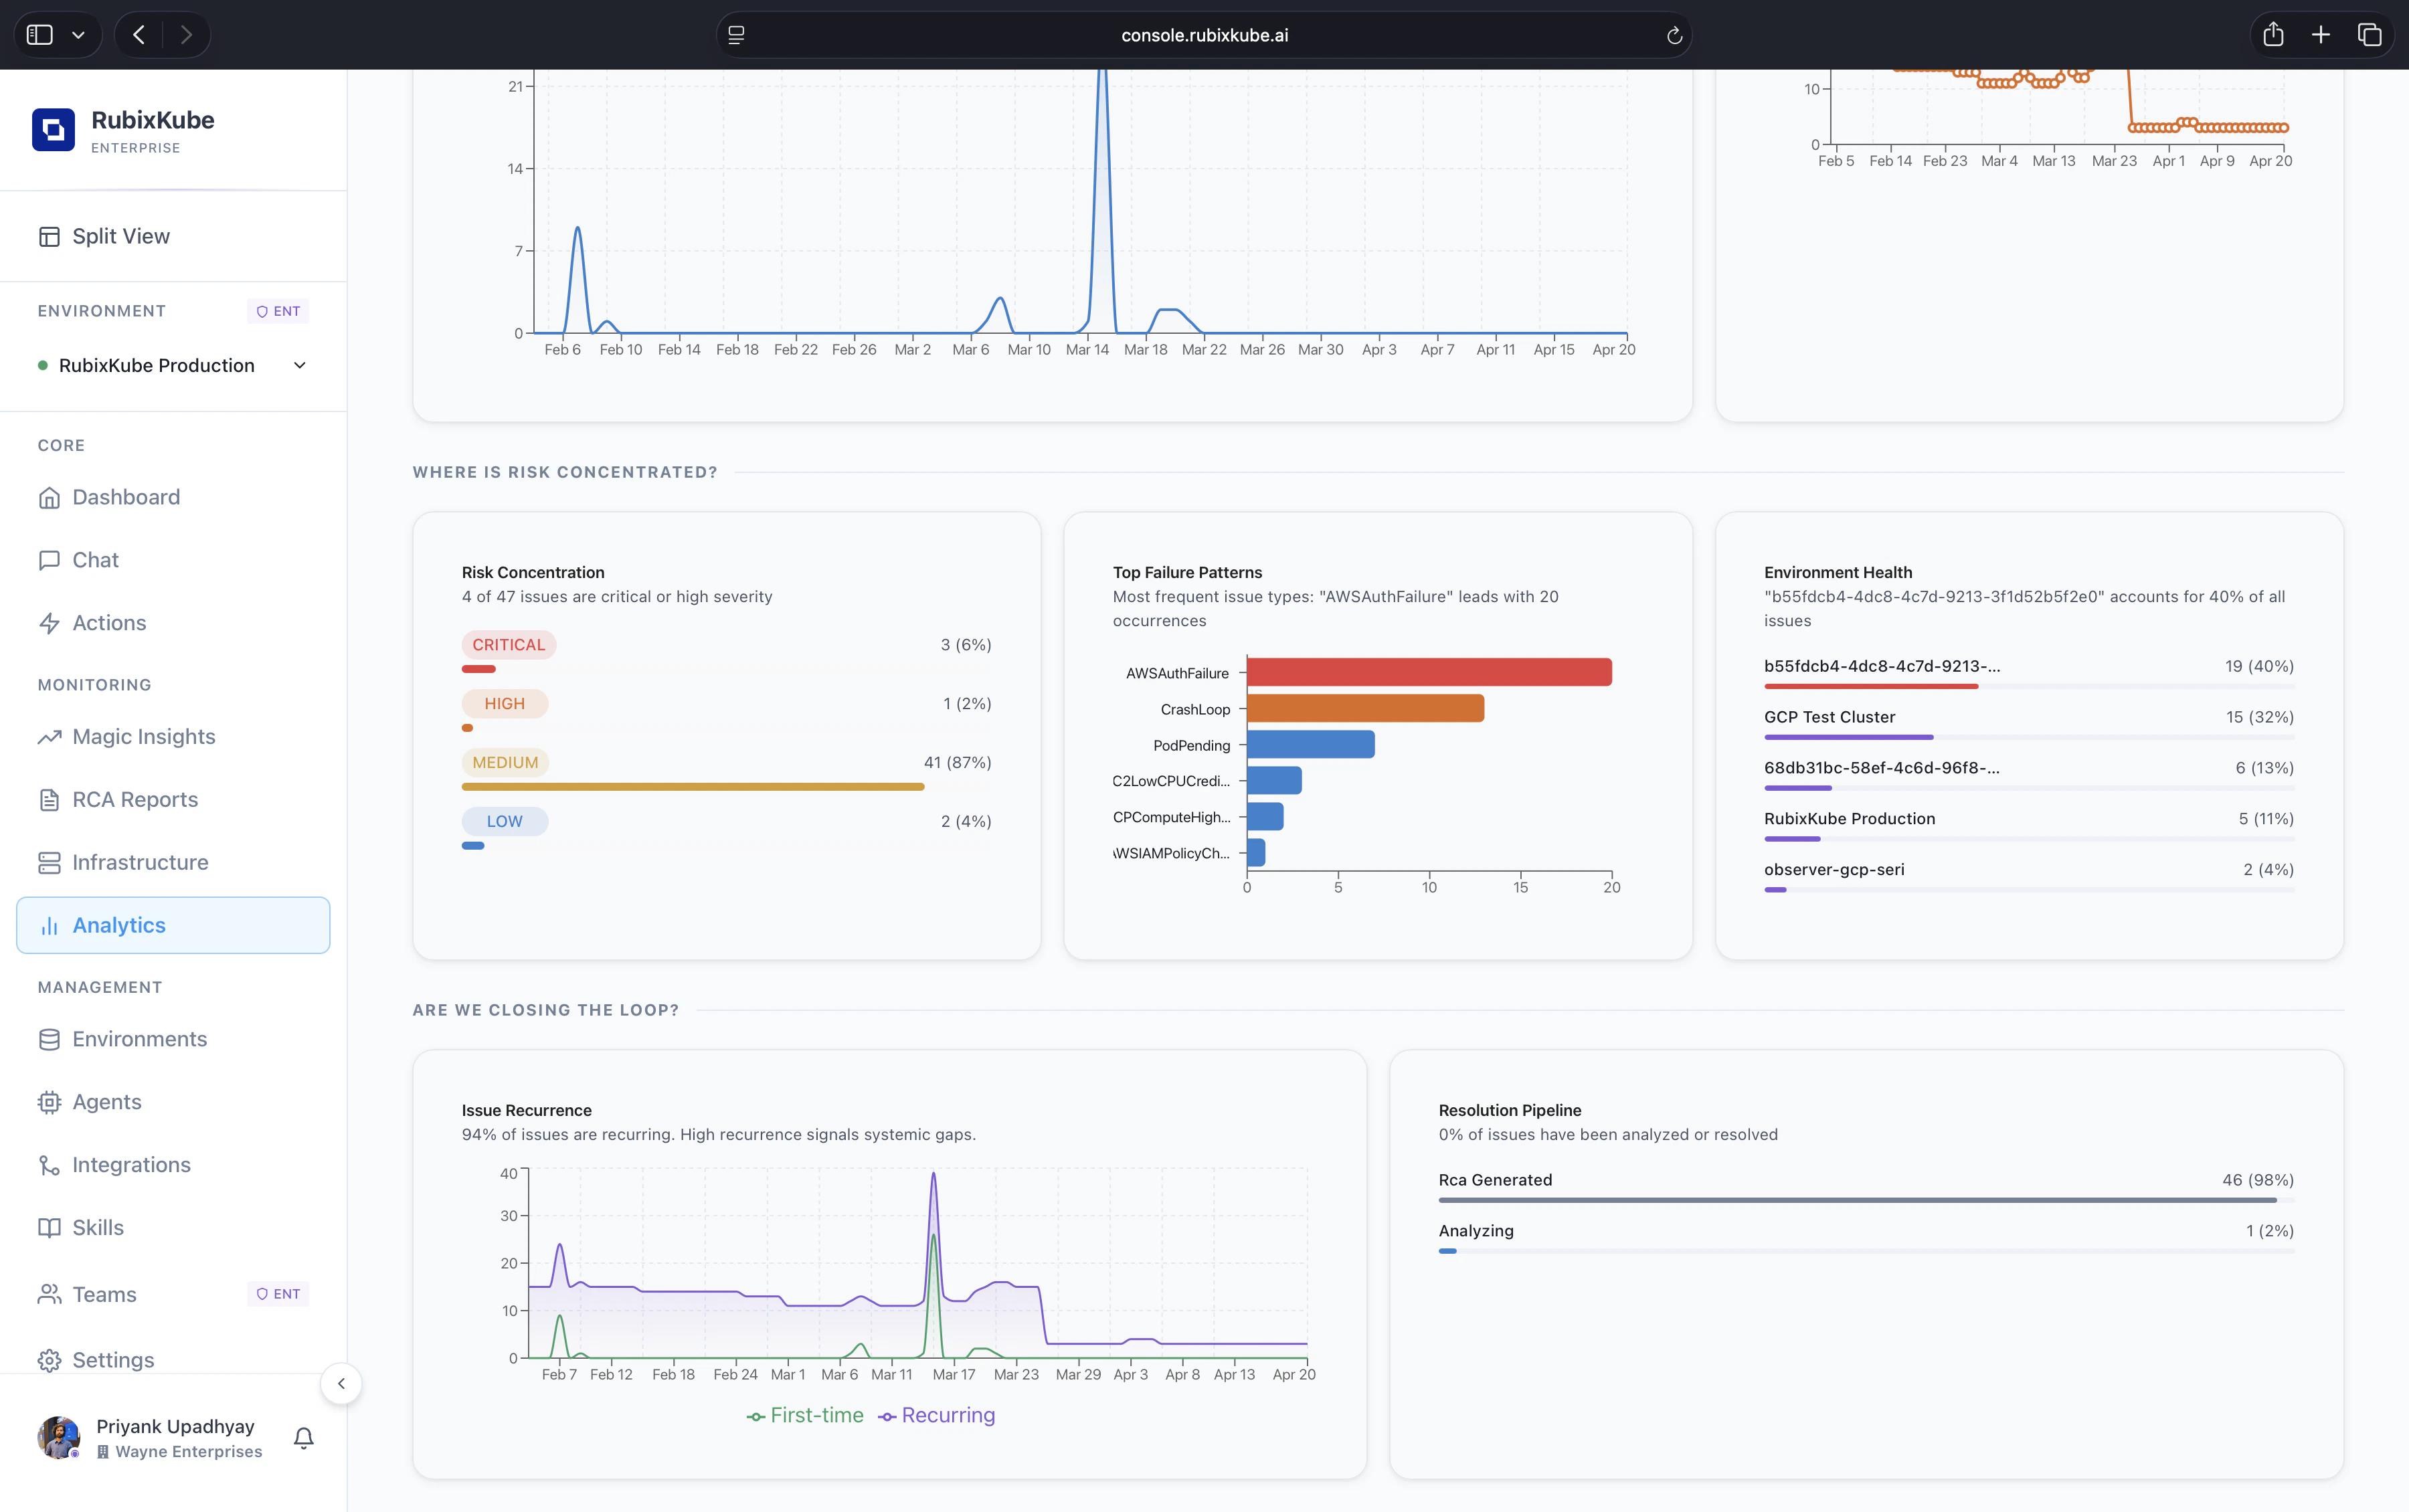 Recurrence tells you whether fixes are sticking. Resolution pipeline tells you whether investigations are keeping up.
* **Issue Recurrence.** Daily count of **First-time** vs **Recurring** issues. A high recurrence share points at systemic gaps that keep tripping the same resources. This is the number to attack if you want to move MTTU down durably.
* **Resolution Pipeline.** A breakdown of issues by pipeline state. How many have an RCA already generated, how many are still being analysed, and how many are waiting to enter the pipeline.
## How to read the page
Pick the last seven days, leave environments on All, and share the value-delivered card plus Issue Recurrence with leadership. Two numbers, one narrative.
Narrow the window to the hours after a release. Issue Volume and Top Failure Patterns tell you whether the deploy introduced a new class of failure.
Pick a single environment for the past thirty days. Risk Concentration and Top Failure Patterns show where to invest hardening time.
Compare two adjacent periods. Rising recurrence or rising Medium severity share often means a class of issue is drifting toward becoming critical.
## Where the numbers come from
Every metric on this page is computed from the same investigations you see in [Magic Insights](/using/insights) and [RCA Reports](/using/rca-reports).
* **MTTU** is the time from insight open to hypothesis acceptance or RCA publication, whichever comes first.
* **Value delivered** uses your configured hourly SRE cost (default `$50/hr`) and a manual-investigation baseline (default `1 hr per issue`). Both are configurable in workspace settings.
* **Recurrence** groups issues by fingerprint. A recurrence is any issue with the same fingerprint as a prior resolved issue inside the selected window.
* **Environment Health** reads the environment tag on each insight and aggregates.
## Common questions
Each panel has an export-to-image and export-to-CSV option from the overflow menu. The value-delivered card and top-level counters have a share link that is scoped to the workspace and revocable.
RCA coverage is the share of insights in the selected window that have a completed RCA Report. Insights with "analysing" or "RCA failed" status do not count as covered.
The most common reasons are a new integration coming online, a noisy new alert rule, or an actual regression. Start with Top Failure Patterns to see whether one class of issue dominates the spike.
Retention follows your plan: 30 days on Business, 13 months on Enterprise. Date pickers clamp to the retention window automatically.
## Related
Every anomaly the product has opened, with hypotheses and immediate steps.
Evidence-linked root-cause reports that feed the analytics engine.
Track remediation actions from proposal to verified fix.
Slice analytics by environment, team, or cloud account.
Recurrence tells you whether fixes are sticking. Resolution pipeline tells you whether investigations are keeping up.
* **Issue Recurrence.** Daily count of **First-time** vs **Recurring** issues. A high recurrence share points at systemic gaps that keep tripping the same resources. This is the number to attack if you want to move MTTU down durably.
* **Resolution Pipeline.** A breakdown of issues by pipeline state. How many have an RCA already generated, how many are still being analysed, and how many are waiting to enter the pipeline.
## How to read the page
Pick the last seven days, leave environments on All, and share the value-delivered card plus Issue Recurrence with leadership. Two numbers, one narrative.
Narrow the window to the hours after a release. Issue Volume and Top Failure Patterns tell you whether the deploy introduced a new class of failure.
Pick a single environment for the past thirty days. Risk Concentration and Top Failure Patterns show where to invest hardening time.
Compare two adjacent periods. Rising recurrence or rising Medium severity share often means a class of issue is drifting toward becoming critical.
## Where the numbers come from
Every metric on this page is computed from the same investigations you see in [Magic Insights](/using/insights) and [RCA Reports](/using/rca-reports).
* **MTTU** is the time from insight open to hypothesis acceptance or RCA publication, whichever comes first.
* **Value delivered** uses your configured hourly SRE cost (default `$50/hr`) and a manual-investigation baseline (default `1 hr per issue`). Both are configurable in workspace settings.
* **Recurrence** groups issues by fingerprint. A recurrence is any issue with the same fingerprint as a prior resolved issue inside the selected window.
* **Environment Health** reads the environment tag on each insight and aggregates.
## Common questions
Each panel has an export-to-image and export-to-CSV option from the overflow menu. The value-delivered card and top-level counters have a share link that is scoped to the workspace and revocable.
RCA coverage is the share of insights in the selected window that have a completed RCA Report. Insights with "analysing" or "RCA failed" status do not count as covered.
The most common reasons are a new integration coming online, a noisy new alert rule, or an actual regression. Start with Top Failure Patterns to see whether one class of issue dominates the spike.
Retention follows your plan: 30 days on Business, 13 months on Enterprise. Date pickers clamp to the retention window automatically.
## Related
Every anomaly the product has opened, with hypotheses and immediate steps.
Evidence-linked root-cause reports that feed the analytics engine.
Track remediation actions from proposal to verified fix.
Slice analytics by environment, team, or cloud account.