> ## Documentation Index
> Fetch the complete documentation index at: https://docs.rubixkube.ai/llms.txt
> Use this file to discover all available pages before exploring further.
# Topology: the map of your infrastructure
> Kepler keeps a map of your clusters, hosts, cloud accounts, databases and repositories, read from the config and CLIs already on your machine. Learn what it finds, how to add what no scan can see, and how to answer what Kepler proposes.
Kepler keeps a map of your infrastructure so it knows what you mean by a name. It builds the map by reading what is already on your machine: your kubeconfig, your SSH config, your cloud CLIs and the repositories in your workspaces. The scan runs in the background and keeps the map current. Ask about `checkout` or `db-7` and Kepler already knows which cluster, host or account you mean.
The map stays on your machine. Kepler only reads what you already have access to, and it does not contact your clusters until you have chosen a model.
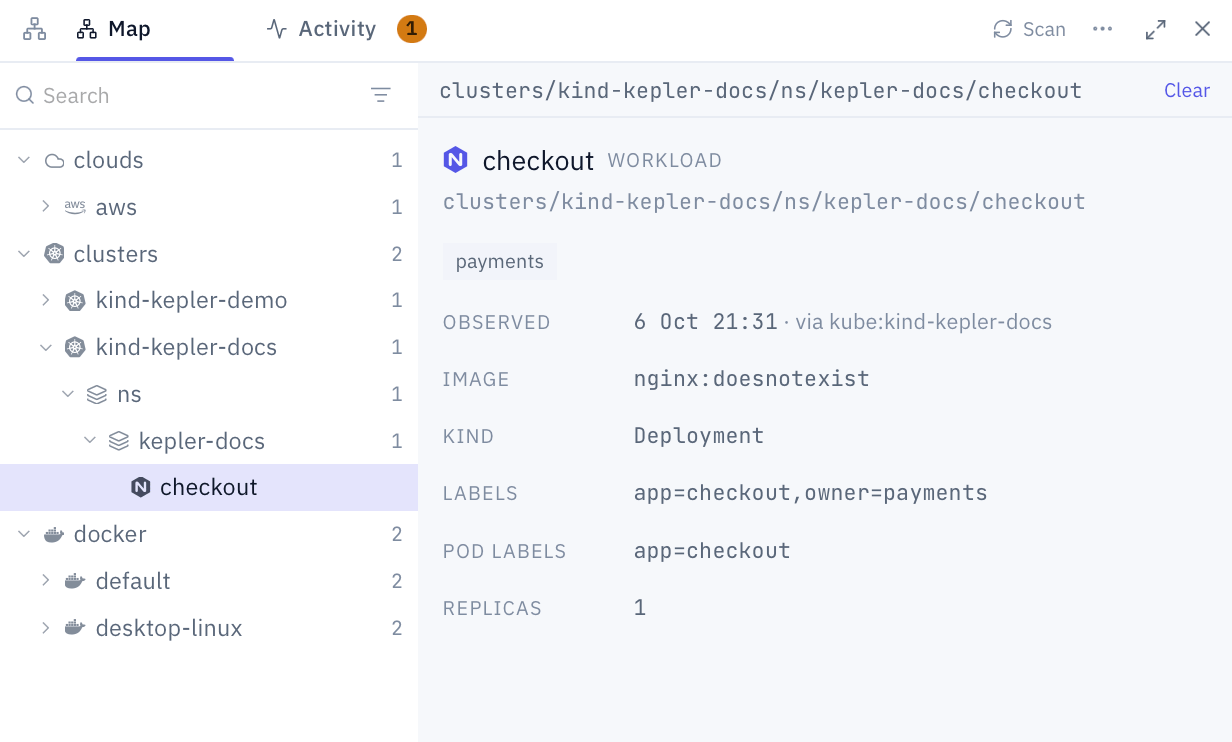 The map. Pick anything in the tree to see what Kepler knows about it.
## Open the map
Click **Topology** in the sidebar. The panel has two tabs:
| Tab | What it shows |
| - | - |
| **Map** | Everything Kepler found, as a tree. Search it, filter it by type, and pick an item to see its details and recent changes. |
| **Activity** | What the scan did, newest first, with **Needs you** at the top when something is waiting for your answer. The tab shows a count while anything waits. |
**Scan** at the top of the panel scans everything now. The **More** menu holds **Recent changes**, a list of what changed across the map, and **Sources and settings**, which opens **Settings > Topology**.
Right-click any item for its actions:
| Action | What it does |
| - | - |
| **Add to chat** | Pins the item to the conversation. Kepler reads the live record, not a copy from when you clicked. |
| **Rescan this** | Scans only the sources behind this item. |
| **Copy path** | Copies the item's path on the map. |
| **Copy kubectl command**, **Copy ssh command**, **Copy image**, **Copy remote**, **Copy local path** | Copies a ready-to-paste value, when the item has one. |
With [Remote access](/kepler/remote-access) on, a host's detail also shows whether it is connected, with **Connect** or **Disconnect**, and **Work here**, which moves the current conversation onto that machine.
## What Kepler reads
Each place Kepler reads is a **source**. Sources are found on your machine automatically.
| Source | What it adds to the map |
| - | - |
| Your SSH config | Hosts, with their address and user. |
| Your kubeconfig | Each cluster, its namespaces and its workloads. |
| Helm | Releases, in the namespace they were installed into. |
| Argo CD and Flux | Applications, with the repository and namespace each one names. |
| Google Cloud, AWS and Azure | Projects, accounts and subscriptions your CLIs are signed in to, with their VMs, clusters and data services. An AWS account is named by its alias or account number. |
| Where to look | Prometheus, Grafana, Alertmanager, Loki, Jaeger and similar tools running in the clusters Kepler already scans, each with the address to open. |
| GitHub and your workspaces | Repositories, with the CI workflows that live in them. |
| Connected tools | Rows from a connected Grafana, Datadog, Prometheus or OpenTelemetry [integration](/kepler/extend#integrations-mcp-servers). |
| Ansible, Teleport and Docker | Inventory hosts and groups, Teleport nodes, Docker engines with their compose projects and containers, and sandboxes. |
| Kepler's list and your own files | Things no scan can see. See [Add what no scan can see](#add-what-no-scan-can-see). |
### How things got there
The map follows the delivery path, so you can ask what built a workload, what installed it and what manages it:
* **CI workflows** from GitHub Actions, GitLab CI, CircleCI and Jenkins sit under the repository that owns them. Each one records what triggers it, the image it builds, and the secrets it needs, by name only.
* **Helm releases** sit in their namespace.
* **Argo CD and Flux applications** carry the repository and namespace they declare.
```
What deployed checkout in prod, and from which repository?
```
### Where the data lives
Databases, caches, queues and buckets are on the map too:
| Cloud | Services |
| - | - |
| AWS | RDS, ElastiCache, DynamoDB, S3, SQS and MSK |
| Google Cloud | Cloud SQL, Memorystore, Cloud Storage and Pub/Sub |
| Azure | AKS, VMs, databases, storage and Service Bus, one source per subscription |
A database keeps its address, so Kepler can match it to the workloads that connect to it:
```
Which workloads talk to orders-db, and what would notice if it stopped?
```
### Where to look when it breaks
Kepler finds the monitoring tools inside your clusters and records the address of each one, so it stops asking where your Grafana is:
```
Open our Grafana and show me the checkout error rate for the last hour.
```
## Add what no scan can see
A database somebody runs by hand, or a machine that is on no list, can be added yourself. Kepler keeps a plain file of these at `~/.kepler/topology/kepler-list.jsonl`, one JSON object per line. The file opens with sample lines to copy:
```json theme={null}
{"host": "db-7", "hostname": "10.0.0.7", "port": 5432, "tags": ["postgres"]}
{"datastore": "orders-mongo", "engine": "mongodb", "hostname": "10.0.0.21", "port": 27017}
```
* `hostname` is the field worth filling in. It is what lets Kepler connect a workload's connection string to the database.
* `engine` names the database and gives it its mark on the map. Kepler recognises the common ones, from `postgres`, `mysql` and `mongodb` to `cassandra`, `kafka`, `redis` and `elasticsearch`. The file lists them all. Any other engine works too and gets a generic mark.
* Delete a line and the next scan takes it off the map.
A host in this file is also somewhere Kepler can work. To connect through a VPN or a wrapper script, give it your own connect command. See [A machine that needs more than ssh](/kepler/remote-access#a-machine-that-needs-more-than-ssh).
To add a list you already keep, open **Settings > Topology** and use **Add your own list** with the path to the file. It takes JSON lines or YAML, one machine per entry.
## Answer what Kepler proposes
Kepler learns from your conversations. When you mention a host it has never seen, an inventory file, or a nickname for something on the map, it proposes adding it. A proposal never changes the map on its own. It waits under **Needs you** on the Activity tab:
| Proposal | Your answer |
| - | - |
| Add a host or a database to the map | **Add** or **No**. An added item is written to `kepler-list.jsonl`. |
| Read a file, such as an inventory, into the map | **Add** or **No**. |
| Call something by another name | **Keep** or **No**. |
Each proposal quotes what was said that led to it, and counts how often it came up. When several are waiting, **Keep all** and **Decline all** answer them in one step. A proposal you decline is not offered again, and one nobody answers expires after 30 days.
Telling Kepler something directly is different from Kepler working it out. "When I say prod, I mean gke-prod-eu" is an instruction and is saved at once. A guess from the conversation always waits for you.
The map. Pick anything in the tree to see what Kepler knows about it.
## Open the map
Click **Topology** in the sidebar. The panel has two tabs:
| Tab | What it shows |
| - | - |
| **Map** | Everything Kepler found, as a tree. Search it, filter it by type, and pick an item to see its details and recent changes. |
| **Activity** | What the scan did, newest first, with **Needs you** at the top when something is waiting for your answer. The tab shows a count while anything waits. |
**Scan** at the top of the panel scans everything now. The **More** menu holds **Recent changes**, a list of what changed across the map, and **Sources and settings**, which opens **Settings > Topology**.
Right-click any item for its actions:
| Action | What it does |
| - | - |
| **Add to chat** | Pins the item to the conversation. Kepler reads the live record, not a copy from when you clicked. |
| **Rescan this** | Scans only the sources behind this item. |
| **Copy path** | Copies the item's path on the map. |
| **Copy kubectl command**, **Copy ssh command**, **Copy image**, **Copy remote**, **Copy local path** | Copies a ready-to-paste value, when the item has one. |
With [Remote access](/kepler/remote-access) on, a host's detail also shows whether it is connected, with **Connect** or **Disconnect**, and **Work here**, which moves the current conversation onto that machine.
## What Kepler reads
Each place Kepler reads is a **source**. Sources are found on your machine automatically.
| Source | What it adds to the map |
| - | - |
| Your SSH config | Hosts, with their address and user. |
| Your kubeconfig | Each cluster, its namespaces and its workloads. |
| Helm | Releases, in the namespace they were installed into. |
| Argo CD and Flux | Applications, with the repository and namespace each one names. |
| Google Cloud, AWS and Azure | Projects, accounts and subscriptions your CLIs are signed in to, with their VMs, clusters and data services. An AWS account is named by its alias or account number. |
| Where to look | Prometheus, Grafana, Alertmanager, Loki, Jaeger and similar tools running in the clusters Kepler already scans, each with the address to open. |
| GitHub and your workspaces | Repositories, with the CI workflows that live in them. |
| Connected tools | Rows from a connected Grafana, Datadog, Prometheus or OpenTelemetry [integration](/kepler/extend#integrations-mcp-servers). |
| Ansible, Teleport and Docker | Inventory hosts and groups, Teleport nodes, Docker engines with their compose projects and containers, and sandboxes. |
| Kepler's list and your own files | Things no scan can see. See [Add what no scan can see](#add-what-no-scan-can-see). |
### How things got there
The map follows the delivery path, so you can ask what built a workload, what installed it and what manages it:
* **CI workflows** from GitHub Actions, GitLab CI, CircleCI and Jenkins sit under the repository that owns them. Each one records what triggers it, the image it builds, and the secrets it needs, by name only.
* **Helm releases** sit in their namespace.
* **Argo CD and Flux applications** carry the repository and namespace they declare.
```
What deployed checkout in prod, and from which repository?
```
### Where the data lives
Databases, caches, queues and buckets are on the map too:
| Cloud | Services |
| - | - |
| AWS | RDS, ElastiCache, DynamoDB, S3, SQS and MSK |
| Google Cloud | Cloud SQL, Memorystore, Cloud Storage and Pub/Sub |
| Azure | AKS, VMs, databases, storage and Service Bus, one source per subscription |
A database keeps its address, so Kepler can match it to the workloads that connect to it:
```
Which workloads talk to orders-db, and what would notice if it stopped?
```
### Where to look when it breaks
Kepler finds the monitoring tools inside your clusters and records the address of each one, so it stops asking where your Grafana is:
```
Open our Grafana and show me the checkout error rate for the last hour.
```
## Add what no scan can see
A database somebody runs by hand, or a machine that is on no list, can be added yourself. Kepler keeps a plain file of these at `~/.kepler/topology/kepler-list.jsonl`, one JSON object per line. The file opens with sample lines to copy:
```json theme={null}
{"host": "db-7", "hostname": "10.0.0.7", "port": 5432, "tags": ["postgres"]}
{"datastore": "orders-mongo", "engine": "mongodb", "hostname": "10.0.0.21", "port": 27017}
```
* `hostname` is the field worth filling in. It is what lets Kepler connect a workload's connection string to the database.
* `engine` names the database and gives it its mark on the map. Kepler recognises the common ones, from `postgres`, `mysql` and `mongodb` to `cassandra`, `kafka`, `redis` and `elasticsearch`. The file lists them all. Any other engine works too and gets a generic mark.
* Delete a line and the next scan takes it off the map.
A host in this file is also somewhere Kepler can work. To connect through a VPN or a wrapper script, give it your own connect command. See [A machine that needs more than ssh](/kepler/remote-access#a-machine-that-needs-more-than-ssh).
To add a list you already keep, open **Settings > Topology** and use **Add your own list** with the path to the file. It takes JSON lines or YAML, one machine per entry.
## Answer what Kepler proposes
Kepler learns from your conversations. When you mention a host it has never seen, an inventory file, or a nickname for something on the map, it proposes adding it. A proposal never changes the map on its own. It waits under **Needs you** on the Activity tab:
| Proposal | Your answer |
| - | - |
| Add a host or a database to the map | **Add** or **No**. An added item is written to `kepler-list.jsonl`. |
| Read a file, such as an inventory, into the map | **Add** or **No**. |
| Call something by another name | **Keep** or **No**. |
Each proposal quotes what was said that led to it, and counts how often it came up. When several are waiting, **Keep all** and **Decline all** answer them in one step. A proposal you decline is not offered again, and one nobody answers expires after 30 days.
Telling Kepler something directly is different from Kepler working it out. "When I say prod, I mean gke-prod-eu" is an instruction and is saved at once. A guess from the conversation always waits for you.
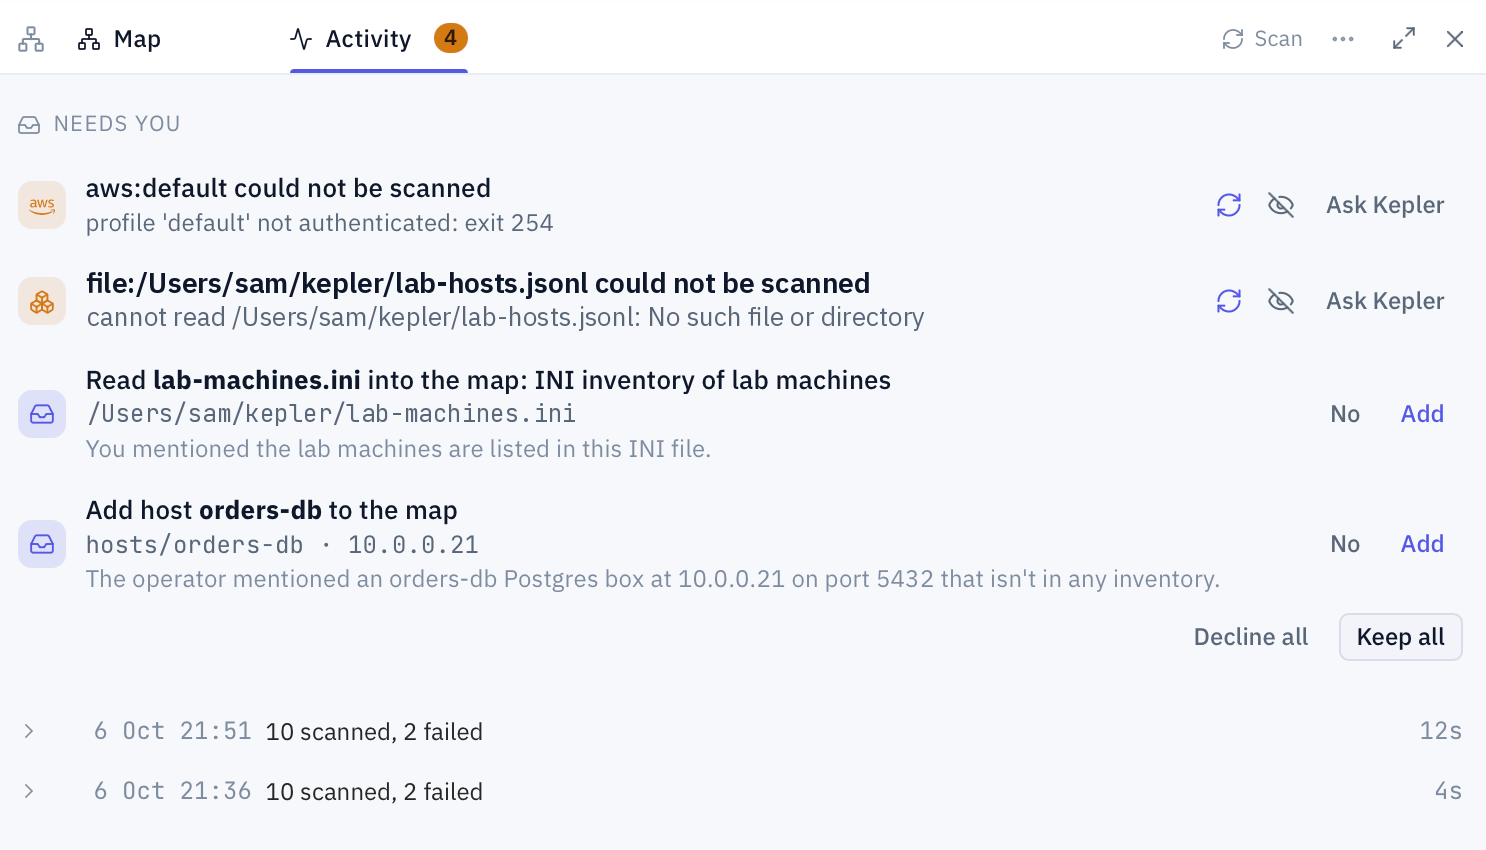 Needs you holds what Kepler cannot settle on its own: sources that failed and proposals from your conversations.
## When a source fails
A source that cannot be read shows under **Needs you** with the reason it gave, such as an expired cloud login. Three ways out:
* **Try again** scans that source once more. Use it after you have signed in again or fixed access.
* **Ignore** opens the source in **Settings > Topology**, where you can skip it.
* **Ask Kepler** starts a conversation with the error, so Kepler can work out the cause and tell you what to run.
A source that fails stays in the rotation, so it recovers on its own once access is back.
## Settings > Topology
| Setting | What it does |
| - | - |
| Scanning | On or paused. |
| Frequency | How often Kepler checks for changes: every 5, 15 or 30 minutes, every hour, or every 6 hours. |
| Enrich from chat sessions | How often Kepler reads your recent conversations to learn what you call things and tag what belongs together: never, or every 4, 8 or 16 scans. |
| Sources | Every source with its status: **Not scanned yet**, **Working**, **Failed** or **Skipped**. Filter the list to see only problems. |
| Add your own list | Read a file of machines you keep yourself. |
| Connected tools | Integrations that can feed the map, with **Add** for the ones not added yet. |
| Clear the map | Start the map over. |
## Ask about it in chat
You rarely need to open the panel. Ask in plain words and Kepler looks it up on the map:
```
What changed in the payments namespace this week?
```
```
Which hosts are in the web group, and which ones can I connect to?
```
```
What does api-prod-2 run, and what sits behind the same load balancer?
```
## Where to go next
Work on a host from the map.
What Kepler remembers beyond the map.
Integrations that feed the map.
The Topology section in Settings.
This documentation is built and hosted on [Mintlify](https://mintlify.com), a developer documentation platform.
Needs you holds what Kepler cannot settle on its own: sources that failed and proposals from your conversations.
## When a source fails
A source that cannot be read shows under **Needs you** with the reason it gave, such as an expired cloud login. Three ways out:
* **Try again** scans that source once more. Use it after you have signed in again or fixed access.
* **Ignore** opens the source in **Settings > Topology**, where you can skip it.
* **Ask Kepler** starts a conversation with the error, so Kepler can work out the cause and tell you what to run.
A source that fails stays in the rotation, so it recovers on its own once access is back.
## Settings > Topology
| Setting | What it does |
| - | - |
| Scanning | On or paused. |
| Frequency | How often Kepler checks for changes: every 5, 15 or 30 minutes, every hour, or every 6 hours. |
| Enrich from chat sessions | How often Kepler reads your recent conversations to learn what you call things and tag what belongs together: never, or every 4, 8 or 16 scans. |
| Sources | Every source with its status: **Not scanned yet**, **Working**, **Failed** or **Skipped**. Filter the list to see only problems. |
| Add your own list | Read a file of machines you keep yourself. |
| Connected tools | Integrations that can feed the map, with **Add** for the ones not added yet. |
| Clear the map | Start the map over. |
## Ask about it in chat
You rarely need to open the panel. Ask in plain words and Kepler looks it up on the map:
```
What changed in the payments namespace this week?
```
```
Which hosts are in the web group, and which ones can I connect to?
```
```
What does api-prod-2 run, and what sits behind the same load balancer?
```
## Where to go next
Work on a host from the map.
What Kepler remembers beyond the map.
Integrations that feed the map.
The Topology section in Settings.
This documentation is built and hosted on [Mintlify](https://mintlify.com), a developer documentation platform.