> ## Documentation Index
> Fetch the complete documentation index at: https://docs.rubixkube.ai/llms.txt
> Use this file to discover all available pages before exploring further.
# Welcome to RubixKube
> RubixKube is the Reliability Layer for the AI era. An AI-native mesh of agents that watches your infrastructure, diagnoses root cause, and keeps systems alive across Kubernetes, AWS, GCP, and Linux VMs.
# AI is shipping your product. RubixKube keeps it alive.
RubixKube is the **Reliability Layer for the AI era**. An AI-native mesh of agents that watches your infrastructure continuously, diagnoses root cause when something breaks, and keeps systems alive while your team builds.
Think of it as a **second brain for your infrastructure**:
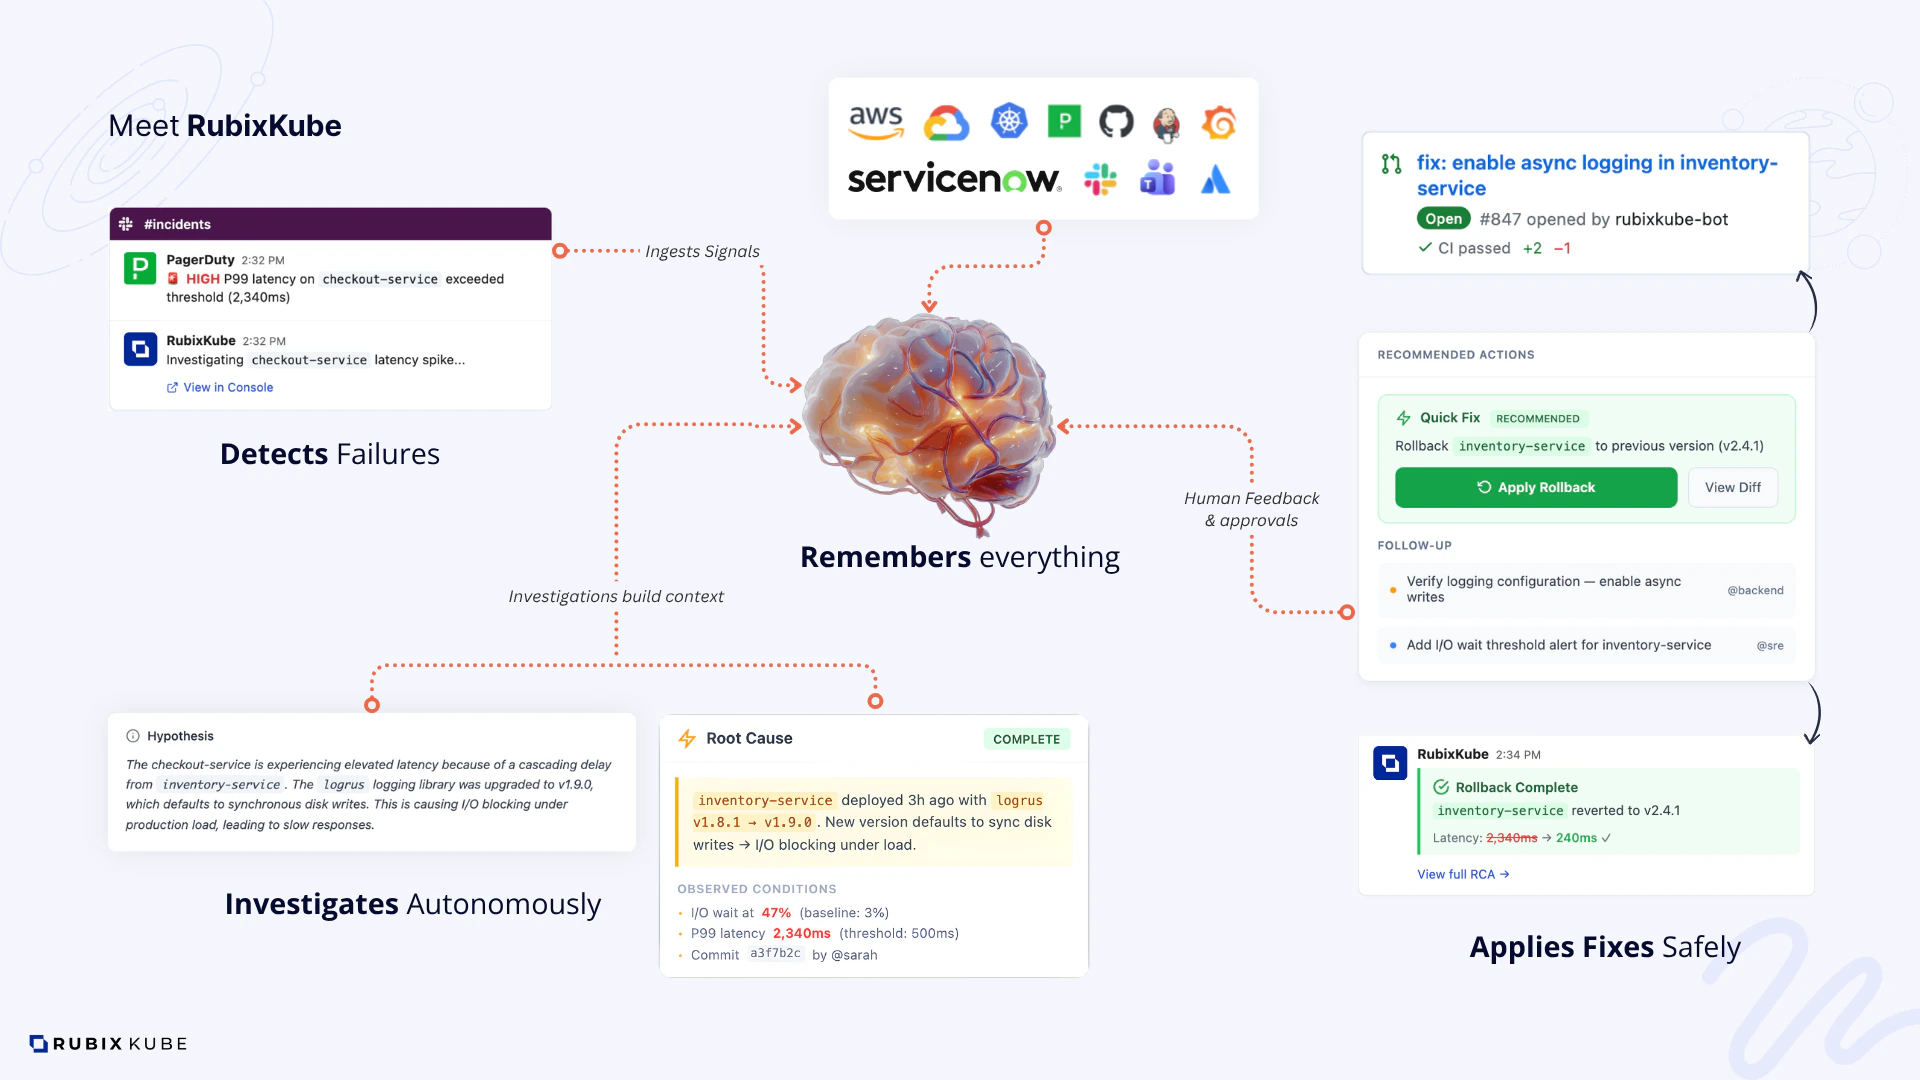 * **Observes and understands** your systems like a seasoned SRE
* **Diagnoses** issues with evidence, and shows you the blast radius
* **Proposes or applies** safe fixes, inside guardrails you control
* **Connects** every failure to real business impact
## Who is RubixKube for?
Cut MTTU from hours to minutes. Keep the on-call rotation sane.
Fewer false alerts, more real answers. Spend time building, not grepping logs.
Reliability becomes a metric you can actually report on. Revenue stays protected.
## What production teams are seeing
Mean time to understand each issue, measured across twelve production teams.
Than manual investigation, with a full evidence trail on every answer.
Of material issues, paired with a 90% drop in alert noise.
Curious about the MTTU story? Read [Stop optimizing for MTTR, the real bottleneck is MTTU](https://rubixkube.ai/blog/stop-optimizing-for-mttr-the-real-bottleneck-is-mttu-ai-sre-solves-it) on the blog.
## How RubixKube works
RubixKube runs a mesh of specialised AI agents that each own a piece of the reliability workflow: observation, memory, root cause analysis, safe action. They share one knowledge graph of your infrastructure, so every incident makes the next one easier to solve.
Map every service, node, and edge across your environments. Learn what normal looks like.
When something drifts, gather logs, metrics, events, and recent changes. Correlate them into a causal chain.
Recommend or apply the right fix, within guardrails you control. Blast radius is calculated before anything runs.
Every incident, correction, and conversation updates the Memory Engine. Your system gets sharper every week.
This is the **OPEL loop**: Observe, Plan, Execute, Learn. It is the core rhythm of the product.
Read the [OPEL loop origin story](https://rubixkube.ai/blog/the-age-of-site-reliability-intelligence-sri) for the long-form explanation.
## A system that learns your stack
The loop runs on every incident. The interesting part is what happens between incidents. Most tools see your infrastructure for the first time, every time. RubixKube remembers. Every signal, session, and resolution builds a deeper model of your system, one that compounds over time and belongs entirely to you.
Topology mapped. Every service, node, and edge, automatically.
Dependencies understood. Upstream and downstream relationships known.
Causality emerging. Failure patterns surface before they fire.
Yours, entirely. A model no other tool has, built only by being there.
Compounding memory is the point. Read how the [Memory Engine](/concepts/memory-engine) and the [Knowledge Graph](/concepts/knowledge-graph) turn every incident into durable institutional context.
## What environments are supported?
RubixKube is environment-agnostic. One workspace can mix any of the following:
EKS, GKE, AKS, KIND, and bare metal clusters on v1.24 or later. Installs via `kubectl apply`.
Account-level observation across EC2, RDS, Lambda, S3, ELB, CloudTrail, and CloudWatch.
Project-level observation across GCE, GKE, Cloud SQL, Cloud Run, Cloud Storage, and Cloud Functions.
Any modern Linux host, cloud or on premise. CPU, memory, disk, process, and network signals.
Azure workloads running on AKS are covered through the Kubernetes path. Subscription-level Azure observation (App Service, Azure VMs, managed data) is on the roadmap.
## Root cause, not just the symptom
Every anomaly RubixKube opens carries a full investigation: observed conditions, causal chain, and recommended actions. An answer, with evidence. Not just an alert.
Every anomaly we have opened, with a hypothesis, immediate steps, and a completed root cause when the evidence converges.
Evidence-linked postmortems. Every claim cites the log, metric, or event that supports it.
## Autonomous, not reckless
RubixKube watches, analyses, and recommends. Your team decides what to do. Nothing changes in your environment without explicit approval, and every action is scoped by Guardian policies and audited end to end.
The full safety model: least privilege, approvals, audits, and policy.
## The point of all this
> Not a faster tool. A smarter system. And one that is entirely yours.
Every incident you resolve without RubixKube is context it never learns from. Every one you resolve with it makes the next one easier.
## Where to go next
The ten-minute path from zero to your first investigation.
Install steps for every supported environment.
Site Reliability Intelligence, the Agent Mesh, and the Memory Engine, from first principles.
Hands-on scenarios you can run against a real environment.
## Common questions
No. RubixKube brings its own observation layer. If you already run Prometheus, Datadog, New Relic, or similar, custom integrations let RubixKube read those signals too.
The Observer runs with read-only permissions by default. Any action that could change state requires an approval step, and every action is scoped by Guardian policies. See [Safety and Guardrails](/concepts/guardrails).
Typically around 255Mi RAM and under 10 millicores of CPU for the in-cluster Observer and Kubernetes MCP server combined. All heavier agents run in RubixKube Cloud, so your cluster stays light.
Yes. The [Kubernetes quickstart](/environments/kubernetes) supports KIND, so you can run the whole stack on a laptop.
## Open source documentation
These docs are open source. If you spot a gap, an unclear section, or an error, the fastest fix is a pull request.
How to propose edits, report issues, and run the docs locally.
Source for every page you are reading.
* **Observes and understands** your systems like a seasoned SRE
* **Diagnoses** issues with evidence, and shows you the blast radius
* **Proposes or applies** safe fixes, inside guardrails you control
* **Connects** every failure to real business impact
## Who is RubixKube for?
Cut MTTU from hours to minutes. Keep the on-call rotation sane.
Fewer false alerts, more real answers. Spend time building, not grepping logs.
Reliability becomes a metric you can actually report on. Revenue stays protected.
## What production teams are seeing
Mean time to understand each issue, measured across twelve production teams.
Than manual investigation, with a full evidence trail on every answer.
Of material issues, paired with a 90% drop in alert noise.
Curious about the MTTU story? Read [Stop optimizing for MTTR, the real bottleneck is MTTU](https://rubixkube.ai/blog/stop-optimizing-for-mttr-the-real-bottleneck-is-mttu-ai-sre-solves-it) on the blog.
## How RubixKube works
RubixKube runs a mesh of specialised AI agents that each own a piece of the reliability workflow: observation, memory, root cause analysis, safe action. They share one knowledge graph of your infrastructure, so every incident makes the next one easier to solve.
Map every service, node, and edge across your environments. Learn what normal looks like.
When something drifts, gather logs, metrics, events, and recent changes. Correlate them into a causal chain.
Recommend or apply the right fix, within guardrails you control. Blast radius is calculated before anything runs.
Every incident, correction, and conversation updates the Memory Engine. Your system gets sharper every week.
This is the **OPEL loop**: Observe, Plan, Execute, Learn. It is the core rhythm of the product.
Read the [OPEL loop origin story](https://rubixkube.ai/blog/the-age-of-site-reliability-intelligence-sri) for the long-form explanation.
## A system that learns your stack
The loop runs on every incident. The interesting part is what happens between incidents. Most tools see your infrastructure for the first time, every time. RubixKube remembers. Every signal, session, and resolution builds a deeper model of your system, one that compounds over time and belongs entirely to you.
Topology mapped. Every service, node, and edge, automatically.
Dependencies understood. Upstream and downstream relationships known.
Causality emerging. Failure patterns surface before they fire.
Yours, entirely. A model no other tool has, built only by being there.
Compounding memory is the point. Read how the [Memory Engine](/concepts/memory-engine) and the [Knowledge Graph](/concepts/knowledge-graph) turn every incident into durable institutional context.
## What environments are supported?
RubixKube is environment-agnostic. One workspace can mix any of the following:
EKS, GKE, AKS, KIND, and bare metal clusters on v1.24 or later. Installs via `kubectl apply`.
Account-level observation across EC2, RDS, Lambda, S3, ELB, CloudTrail, and CloudWatch.
Project-level observation across GCE, GKE, Cloud SQL, Cloud Run, Cloud Storage, and Cloud Functions.
Any modern Linux host, cloud or on premise. CPU, memory, disk, process, and network signals.
Azure workloads running on AKS are covered through the Kubernetes path. Subscription-level Azure observation (App Service, Azure VMs, managed data) is on the roadmap.
## Root cause, not just the symptom
Every anomaly RubixKube opens carries a full investigation: observed conditions, causal chain, and recommended actions. An answer, with evidence. Not just an alert.
Every anomaly we have opened, with a hypothesis, immediate steps, and a completed root cause when the evidence converges.
Evidence-linked postmortems. Every claim cites the log, metric, or event that supports it.
## Autonomous, not reckless
RubixKube watches, analyses, and recommends. Your team decides what to do. Nothing changes in your environment without explicit approval, and every action is scoped by Guardian policies and audited end to end.
The full safety model: least privilege, approvals, audits, and policy.
## The point of all this
> Not a faster tool. A smarter system. And one that is entirely yours.
Every incident you resolve without RubixKube is context it never learns from. Every one you resolve with it makes the next one easier.
## Where to go next
The ten-minute path from zero to your first investigation.
Install steps for every supported environment.
Site Reliability Intelligence, the Agent Mesh, and the Memory Engine, from first principles.
Hands-on scenarios you can run against a real environment.
## Common questions
No. RubixKube brings its own observation layer. If you already run Prometheus, Datadog, New Relic, or similar, custom integrations let RubixKube read those signals too.
The Observer runs with read-only permissions by default. Any action that could change state requires an approval step, and every action is scoped by Guardian policies. See [Safety and Guardrails](/concepts/guardrails).
Typically around 255Mi RAM and under 10 millicores of CPU for the in-cluster Observer and Kubernetes MCP server combined. All heavier agents run in RubixKube Cloud, so your cluster stays light.
Yes. The [Kubernetes quickstart](/environments/kubernetes) supports KIND, so you can run the whole stack on a laptop.
## Open source documentation
These docs are open source. If you spot a gap, an unclear section, or an error, the fastest fix is a pull request.
How to propose edits, report issues, and run the docs locally.
Source for every page you are reading.