> ## Documentation Index
> Fetch the complete documentation index at: https://docs.rubixkube.ai/llms.txt
> Use this file to discover all available pages before exploring further.
# AWS with RubixKube
> Account-level observation across EC2, RDS, Lambda, S3, ELB, CloudTrail, and CloudWatch. Installer creates the read-only IAM role and policy for you.
Connect an AWS account and the Observer maps every major service in it: EC2, RDS, Lambda, S3, ELB, CloudTrail, and CloudWatch. The installer provisions a read-only IAM role and attaches the right policies automatically.
You can run the Observer on an existing Linux VM inside your VPC, or let the installer create a fresh EC2 instance.
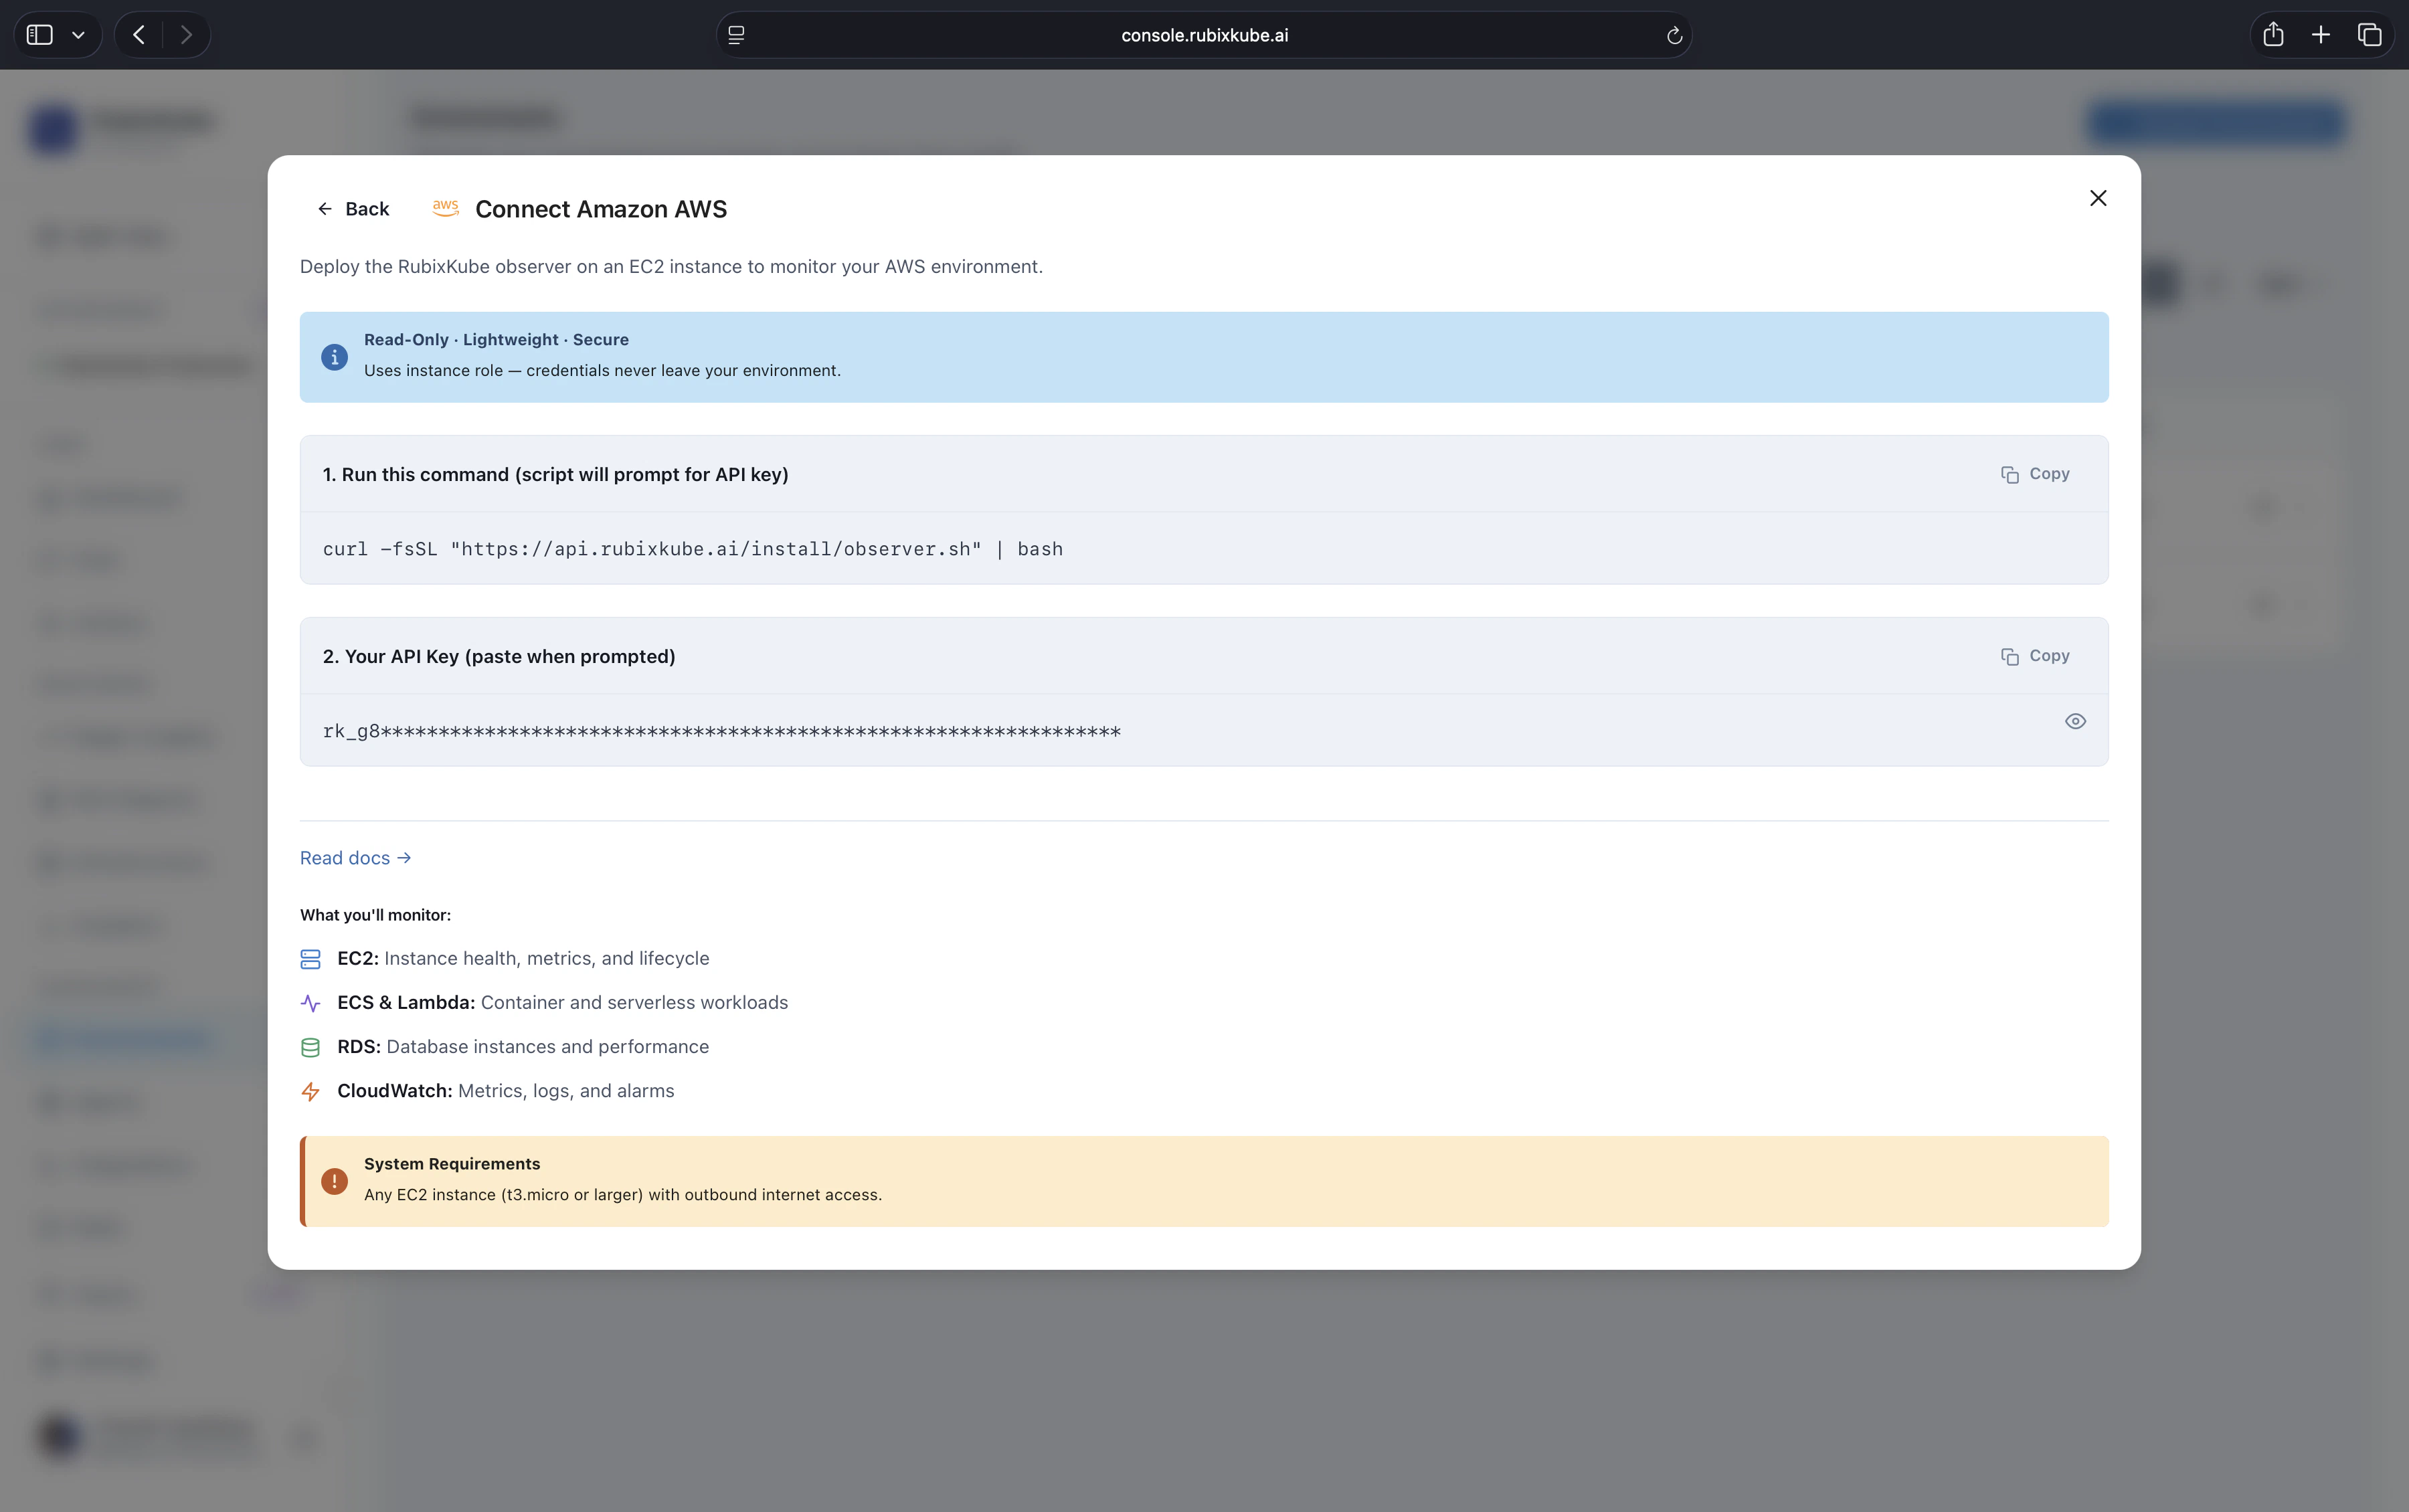 The AWS connect flow in the console. The one-line installer deploys the Observer on an EC2 instance. Credentials never leave your account, the Observer uses the instance role.
## Prerequisites
`aws sts get-caller-identity` must succeed with credentials that can create an IAM role and read the target services.
An existing EC2 instance or any Linux VM with outbound HTTPS. The installer can also spin up a fresh EC2 instance for you.
`api.rubixkube.ai:443` and `nats.rubixkube.ai:443` plus the AWS service endpoints you want to observe.
Create a new AWS environment in the console to get your personal install command.
## Install
On the machine you want to run the Observer on, paste the personal install command. Shape:
```bash theme={null}
curl -fsSL https://api.rubixkube.ai/install/observer.sh | bash -s -- --api-key=rk_YOUR_API_KEY
```
Always copy the command from the console. The embedded API key scopes the Observer to your workspace.
## Interactive flow
The shell installer asks where to deploy. For AWS:
```
What would you like to do?
1) Install Observer
2) Uninstall Observer
> 1
Where do you want to deploy the observer?
1) On this machine
2) Create a new AWS EC2 instance
3) Create a new GCP Compute Engine instance
> 1 (or 2 to have the installer provision a fresh EC2)
Which platform are you monitoring?
1) VM (generic Linux)
2) AWS
3) GCP
> 2
AWS Region [us-east-1]:
```
Pick your region. The installer creates an IAM role named `rk-observer-role`, attaches read-only policies for EC2, RDS, Lambda, S3, ELB, CloudTrail, and CloudWatch, and starts the Observer as a systemd service.
## Verify
```bash theme={null}
sudo systemctl status rubixkube-observer
```
Tail the logs:
```bash theme={null}
sudo journalctl -u rubixkube-observer -f
```
Expect to see `Connected to api.rubixkube.ai` and AWS service discovery messages within the first minute.
```bash theme={null}
aws ec2 describe-instances \
--filters "Name=tag:rubixkube,Values=observer" \
--query 'Reservations[].Instances[].{ID:InstanceId,Status:State.Name,Name:Tags[?Key==`Name`]|[0].Value}'
```
Expected:
```
ID Status Name
i-0abc123... running rk-observer-20251015120000
```
Check console output for boot-time errors:
```bash theme={null}
aws ec2 get-console-output --instance-id i-0abc123... --query 'Output' | grep -i error
```
Within a minute or two, the AWS environment card in the console switches from **Connecting** to **Healthy** and Infrastructure Topology populates with EC2 instances, RDS databases, and related resources.
## What is being monitored
| Service | Signals |
| ------------- | --------------------------------------------------------------------------- |
| EC2 | Instance state, CPU, memory (via CloudWatch), disk, network, scaling events |
| RDS | Instance health, connections, storage, replication, slow queries |
| Lambda | Invocations, duration, errors, throttles, cold starts |
| S3 | Bucket inventory, access patterns, size trends |
| ELB, ALB, NLB | Target health, 4xx/5xx rates, latency percentiles |
| CloudTrail | Reliability-relevant API activity, IAM changes, configuration mutations |
| CloudWatch | Native metrics for the above, plus any custom metrics you publish |
## IAM scope
The installer creates a read-only role. Specifically:
* `ec2:Describe*`, `rds:Describe*`, `s3:List*`, `lambda:List*`, `lambda:Get*`
* `elasticloadbalancing:Describe*`, `cloudwatch:Get*`, `cloudwatch:List*`
* `cloudtrail:Describe*`, `cloudtrail:Lookup*`
No mutating permissions. If you prefer to pre-create the role and supply the ARN, [reach out](mailto:connect@rubixkube.ai) for a manual install path.
## Multi-account setup
Connect each account as its own environment. All of them feed the same workspace, so Chat, Insights, and RCAs span accounts automatically.
For consolidated billing organisations with dozens of accounts, Enterprise customers can bulk-enroll through AWS Organizations. [Email us](mailto:connect@rubixkube.ai) to set this up.
## Troubleshooting
Check logs:
```bash theme={null}
sudo journalctl -u rubixkube-observer -n 50
```
Most common causes: invalid API key, missing AWS credentials on the host, outbound 443 blocked to `api.rubixkube.ai`, clock skew.
Verify the role attached to the host:
```bash theme={null}
aws iam get-user
aws sts get-caller-identity
```
If you are running on EC2, the instance role must include the read-only policies listed above. The installer attaches them when it creates a fresh EC2, but for an existing instance you may need to attach them manually.
Usually CloudWatch does not have metrics for that service in the region yet (newly created resources take a few minutes), or the service is outside the IAM policy scope. Wait two or three minutes, then refresh.
If the Observer sits in a VPC without a NAT gateway or VPC endpoint, AWS API calls will time out. Either add the required VPC endpoints or run the Observer on a host with public egress.
## Uninstall
Rerun the installer and pick option 2 (Uninstall Observer). It stops the systemd service, removes the binary, and deletes the IAM role and attached policies (unless you ask it to keep them).
If the Observer runs on an installer-created EC2 instance, the uninstall also terminates the instance and removes the associated security group.
## Related guides
The full install flow covering every supported environment.
What the Observer does, where it runs, what it sees.
Monitor infrastructure health once the Observer is live.
The AWS connect flow in the console. The one-line installer deploys the Observer on an EC2 instance. Credentials never leave your account, the Observer uses the instance role.
## Prerequisites
`aws sts get-caller-identity` must succeed with credentials that can create an IAM role and read the target services.
An existing EC2 instance or any Linux VM with outbound HTTPS. The installer can also spin up a fresh EC2 instance for you.
`api.rubixkube.ai:443` and `nats.rubixkube.ai:443` plus the AWS service endpoints you want to observe.
Create a new AWS environment in the console to get your personal install command.
## Install
On the machine you want to run the Observer on, paste the personal install command. Shape:
```bash theme={null}
curl -fsSL https://api.rubixkube.ai/install/observer.sh | bash -s -- --api-key=rk_YOUR_API_KEY
```
Always copy the command from the console. The embedded API key scopes the Observer to your workspace.
## Interactive flow
The shell installer asks where to deploy. For AWS:
```
What would you like to do?
1) Install Observer
2) Uninstall Observer
> 1
Where do you want to deploy the observer?
1) On this machine
2) Create a new AWS EC2 instance
3) Create a new GCP Compute Engine instance
> 1 (or 2 to have the installer provision a fresh EC2)
Which platform are you monitoring?
1) VM (generic Linux)
2) AWS
3) GCP
> 2
AWS Region [us-east-1]:
```
Pick your region. The installer creates an IAM role named `rk-observer-role`, attaches read-only policies for EC2, RDS, Lambda, S3, ELB, CloudTrail, and CloudWatch, and starts the Observer as a systemd service.
## Verify
```bash theme={null}
sudo systemctl status rubixkube-observer
```
Tail the logs:
```bash theme={null}
sudo journalctl -u rubixkube-observer -f
```
Expect to see `Connected to api.rubixkube.ai` and AWS service discovery messages within the first minute.
```bash theme={null}
aws ec2 describe-instances \
--filters "Name=tag:rubixkube,Values=observer" \
--query 'Reservations[].Instances[].{ID:InstanceId,Status:State.Name,Name:Tags[?Key==`Name`]|[0].Value}'
```
Expected:
```
ID Status Name
i-0abc123... running rk-observer-20251015120000
```
Check console output for boot-time errors:
```bash theme={null}
aws ec2 get-console-output --instance-id i-0abc123... --query 'Output' | grep -i error
```
Within a minute or two, the AWS environment card in the console switches from **Connecting** to **Healthy** and Infrastructure Topology populates with EC2 instances, RDS databases, and related resources.
## What is being monitored
| Service | Signals |
| ------------- | --------------------------------------------------------------------------- |
| EC2 | Instance state, CPU, memory (via CloudWatch), disk, network, scaling events |
| RDS | Instance health, connections, storage, replication, slow queries |
| Lambda | Invocations, duration, errors, throttles, cold starts |
| S3 | Bucket inventory, access patterns, size trends |
| ELB, ALB, NLB | Target health, 4xx/5xx rates, latency percentiles |
| CloudTrail | Reliability-relevant API activity, IAM changes, configuration mutations |
| CloudWatch | Native metrics for the above, plus any custom metrics you publish |
## IAM scope
The installer creates a read-only role. Specifically:
* `ec2:Describe*`, `rds:Describe*`, `s3:List*`, `lambda:List*`, `lambda:Get*`
* `elasticloadbalancing:Describe*`, `cloudwatch:Get*`, `cloudwatch:List*`
* `cloudtrail:Describe*`, `cloudtrail:Lookup*`
No mutating permissions. If you prefer to pre-create the role and supply the ARN, [reach out](mailto:connect@rubixkube.ai) for a manual install path.
## Multi-account setup
Connect each account as its own environment. All of them feed the same workspace, so Chat, Insights, and RCAs span accounts automatically.
For consolidated billing organisations with dozens of accounts, Enterprise customers can bulk-enroll through AWS Organizations. [Email us](mailto:connect@rubixkube.ai) to set this up.
## Troubleshooting
Check logs:
```bash theme={null}
sudo journalctl -u rubixkube-observer -n 50
```
Most common causes: invalid API key, missing AWS credentials on the host, outbound 443 blocked to `api.rubixkube.ai`, clock skew.
Verify the role attached to the host:
```bash theme={null}
aws iam get-user
aws sts get-caller-identity
```
If you are running on EC2, the instance role must include the read-only policies listed above. The installer attaches them when it creates a fresh EC2, but for an existing instance you may need to attach them manually.
Usually CloudWatch does not have metrics for that service in the region yet (newly created resources take a few minutes), or the service is outside the IAM policy scope. Wait two or three minutes, then refresh.
If the Observer sits in a VPC without a NAT gateway or VPC endpoint, AWS API calls will time out. Either add the required VPC endpoints or run the Observer on a host with public egress.
## Uninstall
Rerun the installer and pick option 2 (Uninstall Observer). It stops the systemd service, removes the binary, and deletes the IAM role and attached policies (unless you ask it to keep them).
If the Observer runs on an installer-created EC2 instance, the uninstall also terminates the instance and removes the associated security group.
## Related guides
The full install flow covering every supported environment.
What the Observer does, where it runs, what it sees.
Monitor infrastructure health once the Observer is live.